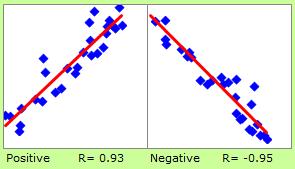
2-dimension scatter plot is used to analyze relationship and 2-dimension distribution.
This page is named "2-dimension" because there is the page, 1-Dimension Scatter Plot . But generally, scatter plot is known as for 2-dimension.
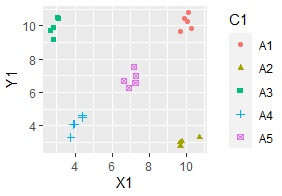
It is useful to check the position of individual data.
It is used as the tool of Judge of Outlier because it is easy to find outliers.
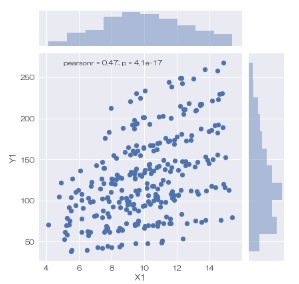
If there are much data, there are piled up areas in the graph. We can understand high-density area. But we cannot understand the difference of density.
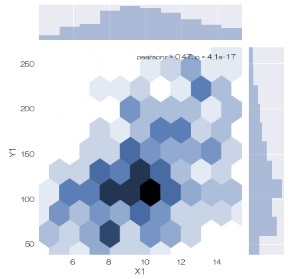
2-dimension
histogram
using
heat map
is useful to analyze the density.
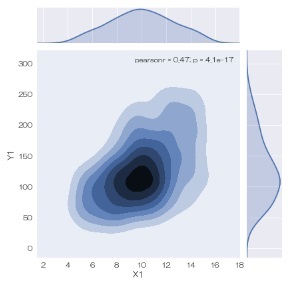
The graphs below are scatter plot, 2-dimension histgram and density distribution.
We can make scatter graph easily by Excel. But stratified graph is not easy by Excel. But ggplot2 and seaborn are easy for thi use.
Plotly is useful for ineteaactive analysis

