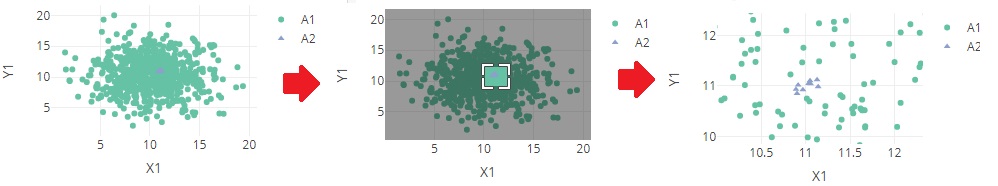
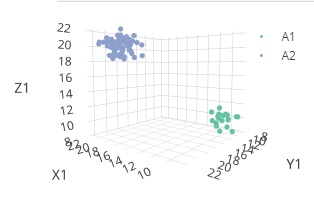
Plotly is used by R and Python. We can analyze interactively by graphs. And use Graph for 3-Dimension .
But
Stratified Graph
is not rich.
library(plotly)
setwd("C:/Rtest")
Data <- read.csv("Data.csv", header=T)
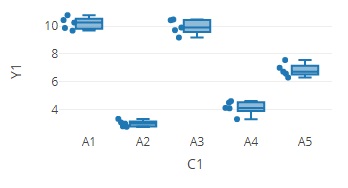
1-Dimension Scatter Plot (jitter)
plot_ly(Data, x=~C1, y=~Y1, type = "box", boxpoints="all",jitter = 0.5)
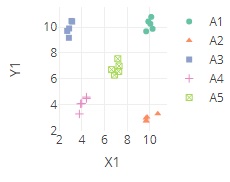
plot_ly(Data, x=~X1, y=~Y1, type = 'scatter', color=~C1, symbol = ~C1)
Without colors and shapes
plot_ly(Data, x=~X1, y=~Y1, type = 'scatter')
plot_ly(Data, x=~X1, y=~Y1, z=~Z1, type = 'scatter3d', color=~C1, symbol = ~C1, marker = list(size = 3))
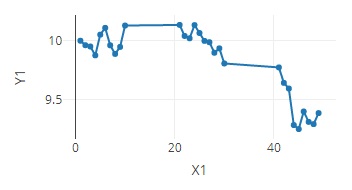
plot_ly(Data, x=~X1, y=~Y1, type = 'scatter', mode = 'lines+markers')
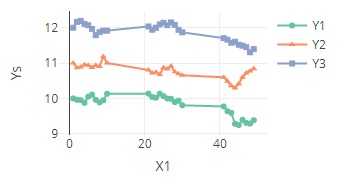
library(tidyr)
Data_long <- tidyr::gather(Data, key="Yno", value = Ys, -X1)
plot_ly(Data_long, x=~X1, y=~Ys, type = 'scatter', color=~Yno, symbol = ~Yno, mode = 'lines+markers')
NEXT  Plot of Panda (matplotlib)
