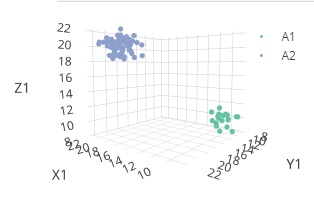
Some software can make 3-dimension scatter plot or sterical shape graph.
But I do not use these type graphs in
Graphical Statics
in the common use.
.
3-dimension graph is difficult to recognize and analyze. So I often change 3-dimension information into 2-dimension.
Esay way that using Heat Map or 2-Dimension Scatter Plot with color.
Plotly can make 3-dimension graph. And we can rotate the grpah.
NEXT  Data Literacy
