Generaly, scatter plot is 2-Dimension Scatter Plot . But there is for 1-dimension.
1-dimension scatter plot is one of the Graphs of 1-Dimension Disribution . 1-dimension scatter plot is used to check the distribution of individual data.
The strong point is that we can check the position of individual data.
We can find outliers easily. So it is useful for Judge of Outlier .
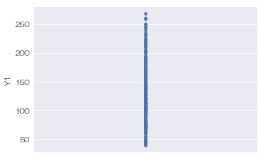
The weak point is that we cannot check high density area because dots are piled up. We can understand that "density is high". But we cannot understand the difference of density value of this area.
Generaly, histogram and box plot are solution for this problem. Jitter and swarm plot are also useful.
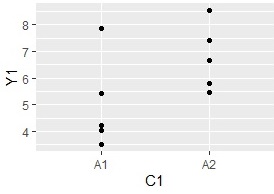
If the numbers of samples are more than about 30, histogram is useful. If the numbers are less than about 10, 1-dimension scatter plot is useful.
If the numbers are between from 10 to 30, 1-dimension scatter plot has high density area.
Some software has the function to scatter data to the right or left to relax the high density area.
This function is called "jitter" in some software.
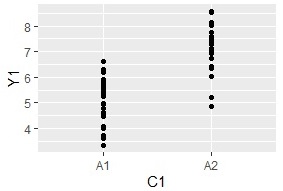
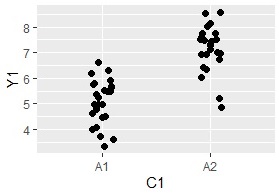
Jitter improve the piled up plots. But it is not improved perfectly. Swarm plot also improve the piled up plot. And it is similar to histogram .
The right is swarm plot.
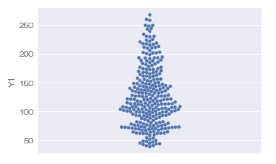
This graph is made by
seaborn
.
The weak point of swarm plot is that it is not good for big data.
NEXT  Histogram
