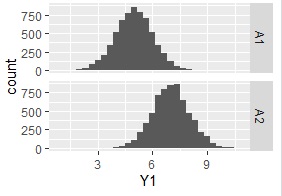
Histgram is one of the Graphs of 1-Dimension Disribution .
Histgram shows the density of the data.
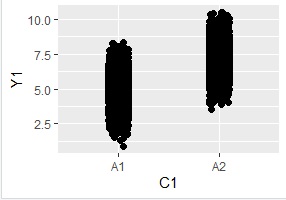
1-Dimension Scatter Plot
is not good to see high density area.
Histgram covers the weakness of scatter plot.
The two graphs below use same data.
Histogram does not show the low density area clearly.
So histgram is not good to find
outlier
.
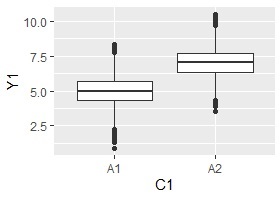
1-Dimension Scatter Plot
and
Box Plot
covers this weakness.
The two graphs below use same data.
The way to define sections of histgram has some points.
Some text books say that the difference between maximum and minimum is separated equally.
In the right figure, maximum is 18.174, mimimum is 2.426
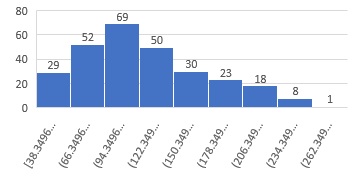
The weakpoint is this method is that it is difficult to use because very small place is used. And we cannot count the NG productions by this diagram because the NG line is not on the border.
I often use the other figure.
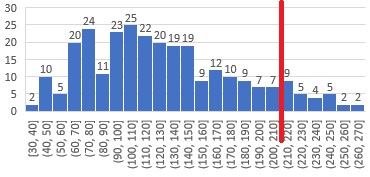
Separation is done by large numbers. And NG line is put on the border.
NEXT  Box Plot
