Panda is one of the packages of Python. We can use data type of Multi-Variable Analysis in Python when we use Panda.
"Plot" of Panda is the function for Graphical Analysis . "Plot" is made with Panda and matplotlib.
This code set is needed before the code starting "df".
import pandas as pd
import matplotlib.pyplot as plt
%matplotlib inline # To draw graphs in Jupyter
df= pd.read_csv("Data.csv")
Graph to visualize many variables
>>>Line graph for all variables
>>>Line graph in different space
>>>Scatter plot for one variable and others
Histgram
>>>2-dimension Histgram
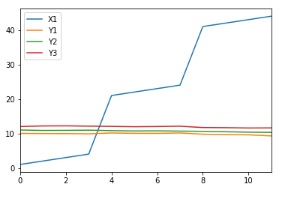
df.plot()
Very simple code! So it is useful as the first step of the data analysis.
But in this example, we do not know details of variables except X1. So we separate graphs for each varaiable.
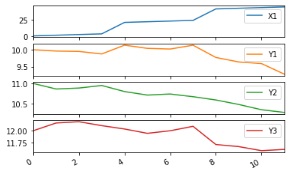
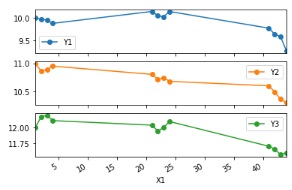
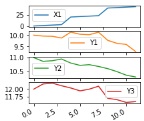
df.plot(subplots=True)
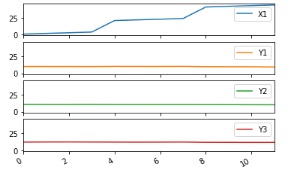
df.plot(subplots=True, sharey=True)# Ranges of Y axis is same
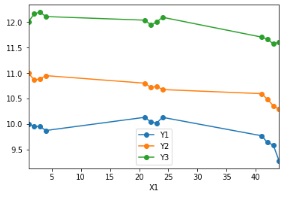
If the variable of X axis is set, x axis is not same space.
If one varaiable is set as X axis, line graphs are made for other variables.
df.plot(x = 'X1',marker="o")
df.plot(x = 'X1', subplots=True, marker="o")
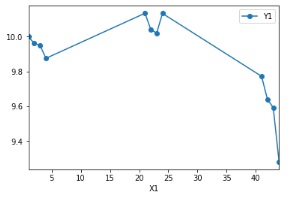
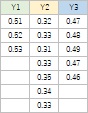
df.plot(x = 'X1',y ='Y1',marker="o")
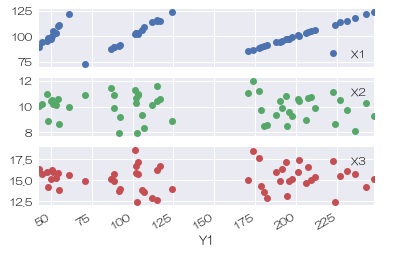
df =df.sort_values('Y1') # Sorting for X variable
df.plot(x = 'Y1', subplots=True, marker="o", linestyle='None')
This page is only the 2 dimenion histgaram. General histgram is written in seaborn page because combination with seaborn is useful.
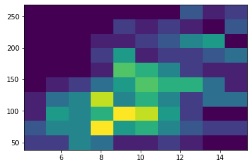
We can make 2-dimension Histgram by matplotlib not by Plot of Panda.
plt.hist2d(x=df.X1,y=df.Y1)
Left graph is default size. Right is the adjusted size.
This code is same for the graphs starting the code "df.".
df.plot(subplots=True,figsize=(3,3))
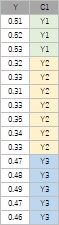
Plot of Panda is good at to use left type data. For the right type data, we need to write many codes.
seaborn
is good at to use right type data.
I use both Plot of Panda and seaborn in the same code set.
NEXT  seaborn
