Difference between 1-Dimension Scatter Plot and 2-Dimension Scatter Plot is not only the distribution. 2-Dimension Scatter Plot is used to analyze the relationship ( correlation )between 2 variables.
Graph of Network is used to analyze relationship.
Graphs for 2-dimension distribution and relationship are useful for Multi-Variable Analysis , Data Mining and Machine Learning .
Two-dimensional scatter plots and network graphs are sometimes used as a way to see the results of Analyzing variable companioning , Analysis of individual category grouping , or Analysis of Similarity of Samples .
Consider each other's strengths and weaknesses and use them properly.
Network graphs can be expressed as "completely similar / partially similar / not completely similar" or "strong / weak / no relationship".
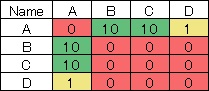
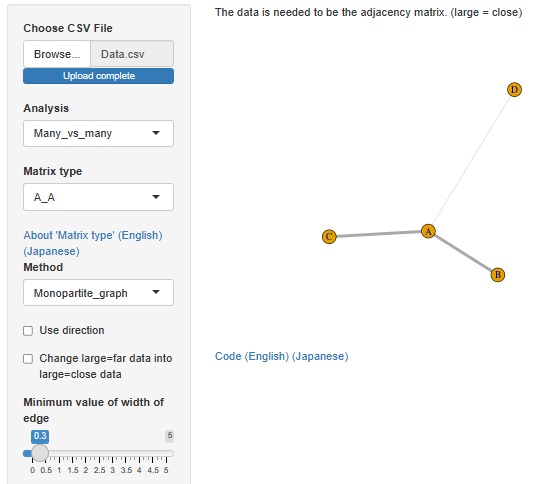
For example, if you make a network graph with the data of the adjacency matrix in the figure below, it will be as shown in the figure on the right.
The numbers in the adjacency matrix are expressed as they are as the presence or absence of edges (lines) and the difference in thickness.
The figure below is obtained by converting this data into distance (large = far) data and using the Multi Dimensional Scaling method to create a scatter plot. In the network graph, you can create a diagram with the edges disappearing. When viewed from D, A, B, and C are the same, and no difference can be seen. Also, A, B, and C look like one group, but I don't know that B and C have no edges.
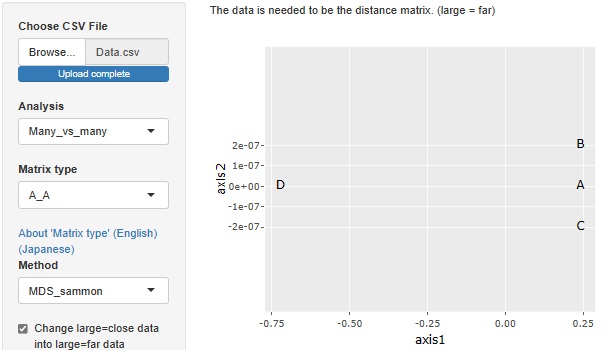
Also, if you want to add orientation information to the edges, you can't do it with a scatter plot.
Network graphs have edges (lines), so the graph is easy to get messed up. Also, it is good when expressing relationships of several tens, but when the scale is larger than that, the processing of the computer tends to become difficult.
There is a way to analyze a 2D scatter plot, knowing that it may not be fully expressed when the processing is difficult in a network graph.
It depends on the analysis target, but for example, if what you are dealing with is "position", if A and B, A and C are close, it is impossible that "B and C are very far". Therefore, depending on what you are analyzing, it may not make sense to use a network graph, and a scatter plot may be able to express the same thing more clearly.

