One way to use unsupervised learning techniques is to analyze data grouping. Sample grouping analysis and variable grouping analysis are well known.
Thinking in that order, the analysis of the grouping of individual categories is the analysis of the third grouping .
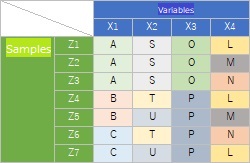
For example, when you have the following data, you can think of categories within the same qualitative variable such as "A, B, C" as "different". However, it seems that there is some relationship for the combination of categories with different qualitative variables of "A, S, O". Analysis of fellow division of the individual categories of the association analysis , correlation analysis of individual categories is an analysis method for finding such a combination. It can be used in a complementary manner to the decision tree .
Rough set analysis is used for supervised learning, and its output is similar to decision trees , but it uses a technique similar to association analysis .
Although I am not familiar with it, correspondence analysis and quantification type III are also likely to be useful as an analysis of grouping of individual categories.
In the analysis of grouping of individual categories, the grouping is based on the degree of correlation of each category.
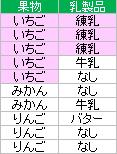
In the case of food data, strawberry and condensed milk are often combined, so it can be said that there is a high correlation. By the way, in text mining, it is called "co-occurrence".
Qualitative variables can be highly correlated with individual qualitative data, even if they are not highly correlated. This analysis is suitable for analysis that focuses on individual parts, so it can also be used for data mining . Association analysis and correlation analysis of individual categories , correspondence analysis has examined these relationships.
There are two types of qualitative data correlation, so basically the method used is also different.
Free software called "Natto" can analyze both the correlation of qualitative variables and the correlation of individual categories. If quantitative variables are mixed, they can be converted into qualitative variables for analysis.
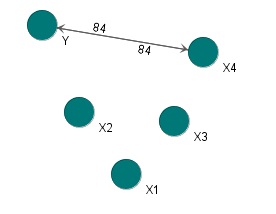
For the same data, the figure on the left shows the correlation of qualitative variables, and the figure on the right shows the results of the correlation of individual categories.
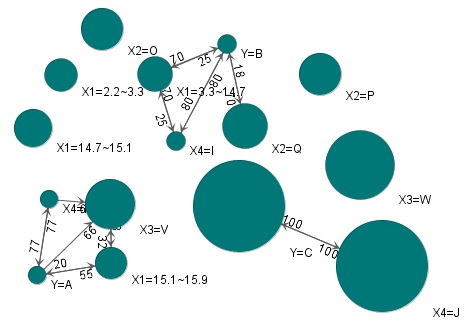
According to food data, when viewed from condensed milk, condensed milk is always paired with strawberry, but when viewed from strawberry, strawberry is not necessarily paired with condensed milk. This is "asymmetry".
With this, you can create an if-then rule that says, "If you buy condensed milk, you also buy strawberries." In sales strategy etc., it seems that this kind of analysis is done using association analysis .
However, with this rule alone, there may be other reasons to buy strawberries. Also, I'm not talking about people who buy strawberries but not condensed milk.
If-then rules alone are not sufficient when using data asymmetry in causality considerations. The details of this area are summarized in the if-then rule and the causal relationship .
Data asymmetry is easy to understand in the highly correlated parts of individual qualitative data, as in this example.
For example, variables A and B have 10 categories each, and the meaning is different when the correlation between the variables is high and when there are 2 categories and the correlation is high.
To take this difference into account, Natto uses information theory .

