I call "Scatter Plot of Words" in this page. There is the graph words are used.
This graph is useful for Principal Component Analysis, Multi Dimensional Scaling, Self Organizing Map and Trend Analysis for Many Variables.
The type of the data is the same. Name X and Y are used. Sample file is here.
Two dimension graph is easy to understand.
For more than the order of 1000, this graph is not so useful. But under the order of 1000, the information of the data is visually understood.
The selection and calculation of the X and Y is depend on the skill of the analysist.
In my daily software, R is only one to make this graph.
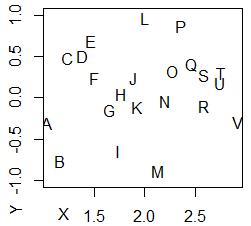
It is the example.
(1) R is needed to be instoled in the computer.
(2) "maptools" is needed to be doenloaded.
(3) Make "Rtest" folder under the C drive.
(4) In the Rtest folder, the data is put. And the name of the data file is "MapData.csv". (CSV type. Comma is used as the delimiter)
(5) The range of Y is from -1 to 1.
library("maptools")
setwd("C:/Rtest")
data <- read.csv('MapData.csv', header=T, sep=",")
data.label<-data$Name
plot(data$X,data$Y,xlab="X",ylab="Y",type="n",ylim=c(-1,1))
pointLabel(x=data$X,y=data$Y,labels=data.label)
NEXT  Graph of Network
