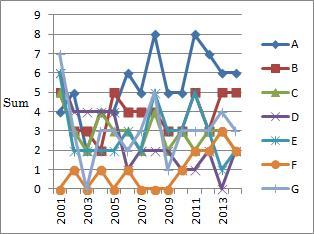
It is difficult to analyze by line-graphs of many variables in Passing Analysis.
But if we want to do 0-1 Data Analysis of the data Associations Analysis or Text Mining, we need to analyze many variables.
But in the business field, "increasing" or "decreasing" are important information of the variables.
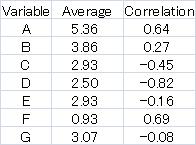
Correlation is used for this analysis. It is the special use of this index.
We think the line graph of time series as scatter graph and analyze the correlation.
Correlation tells us the information of "increasing" or "decreasing".
Evenif the trend is the same, if the volume of frequency is different, the effects of the trends are different.
We can use average to analyze the effect.
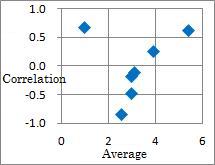
After the calculation of correlation and average for each variable, data becomes simpler. And the graph tells us the tendency of each variable clearly.
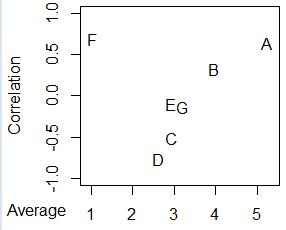
If I want to draw the information of the name of the variable, I use R. The step is written in Dot Graph of Words.
If the calculation of average and correlation is done automatically, we need to recognize that this analysis is rough because average and correlation are weak for the outlier.
We can analyze tendency of words ( Time Series Analysis of words) by the combination of 0-1 Data Analysis and Dot Graph of Words in Text Mining .
The strong point is that we can analyze many words in the one time analysis simply and roughly.
There are many methods of Text Mining . But most methods does not care about time depended phenomena.
Sample File of this page.
NEXT  Trend analysis with small data
