A point process is made up of data that represents a point in time. A type of Time Series Analysis.
As a point process, we have divided it into three types here. The graph is similar, but the information it contains is different. The example below is based on "days", but the same is true even if it is more detailed.
Since the point process data is often data that represents timing and size, the graph below is a bar graph. By the way, for other time series analyses, line graphs are often better.
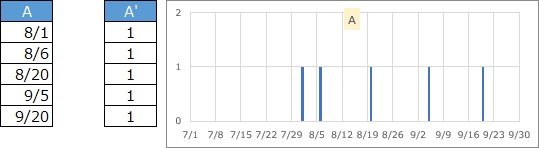
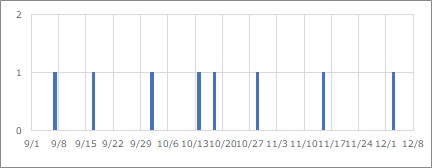
This is the case for data only on the day the event occurred. With earthquake data, you only know if it has occurred.
You can create a graph by adding a column called "1".
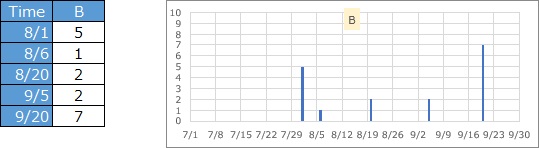
The value is an integer, and one piece of data can be an integer other than 1, which represents the number of cases for that day. If you aggregate the A type, you can make it this type. Also, if you keep a record in a detailed time, you can create type A data instead of type B.
You can create a graph by adding a column called "1".
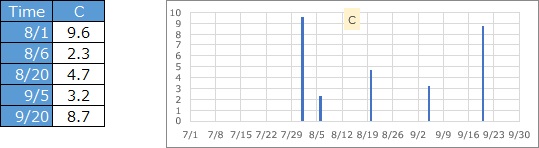
The number of records represented by each data is one, but it represents the magnitude of the value. If it is earthquake data, it corresponds to magnitude and seismic intensity.
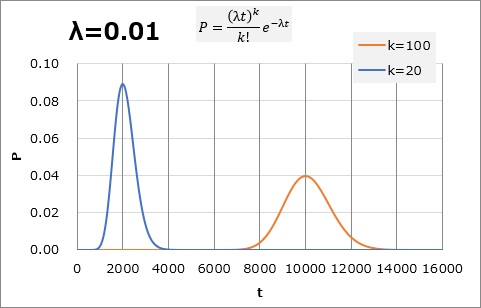
If the way in which data is generated in a point process is considered to be a Poisson distribution, it is called a Poisson process.
On average, if one case occurs in 100 hours (1.0), we can imagine that it will take 01,20 hours for 2000 cases and 100,10000 hours for <> cases, but we can imagine that there is a certain range of times to reach that number. Assuming the width with the Poisson distribution, it is as shown in the graph below.
If reaching 100 is 8000,12000 hours, "Is it too early?" and if it is 100,1 hours, "Is it too late?" You may be tempted to think, That much can be seen that the assumption of "one case in <> hours" is not particularly abnormal in the range of variation.
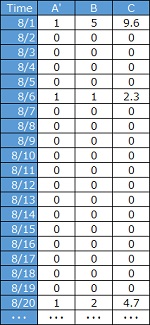
Suppose that in type A above, there is data like the one below.
The incidence rate is considered constant, but to see it more clearly, calculate the time difference and create a scatter plot as shown below. It will be Time Analysis.
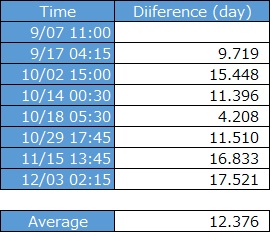
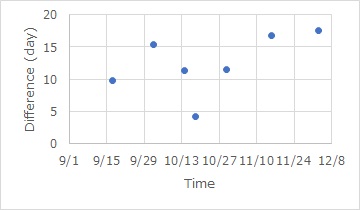
Since the Poisson process assumes that the incidence is constant (stationary), this analysis method is also useful when considering whether it is okay to assume "constant".
Another method is to calculate the cumulative number of occurrences and make a scatter plot.
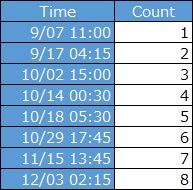
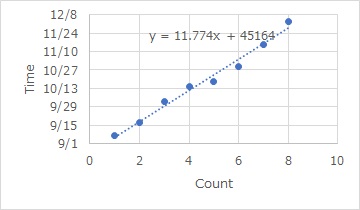
Instead of the time on the X axis and the number of records on the Y axis, here the time is on the Y axis and the number is on the X axis. This allows Single Regression Analysis as a model with varying times for each number. (See Measurement Errors in Regression Analysis)
If they are almost in a straight line, the incidence rate is considered constant.
In the temporal analysis, the average value of the time is "12.376", and the regression analysis is the number "11.774" as the slope, both of which are measured in "day / case". You can see that one case occurs about every 12 days.
Since the calculation methods are different, they will not be exactly the same, but the two methods will yield roughly the same numbers.
By the way, these reciprocals are 0.083 (= 1/12), which is a number that can be used as a probability of occurrence per day in units of "case / day".
Mathematical research is underway on point processes, such as Poisson processes. These theories are only for point process data, but they are not suitable for solving the question "Why did it happen at this timing?"
It is not as beautiful as the mathematical theory of point processes, but the following approach is more suitable for approaching the "why".
Point process data can be spaced for a certain amount of time, such as those used in Self Correlation Analysis and Spectrum Analysis, by compensating for the absence of data. This allows for other types of approaches to Time Series Analysis.
If you do this conversion to type A, you will get 0-1 Data.
In the analysis of Quasi-periodic Data Analysis, there is a method of cutting into the cause of the point process by linking it with the sensor data that was preprocessed in the Analysis of Type 3.
Another way to use Reverse Time Aggregation is to use the time of the point process data as the starting point when going back in time.
NEXT  Poisson Process
