 ---(1)
is calculated by Single Regression Analysis .
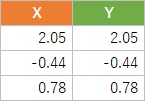
Data table is the examples of 3 samples in the 1000 sample.
General data includes Measurement Errors . For example, "True is 5.2. But measured value is 5.4. So data is 5.4"
In this page, I use Simulation of Dispersion Model to consider the effect of Measurement Errors in Regression Analysis . We can analyze "What is happend usinf true values?"
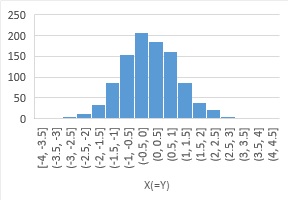
Histogram is the data of 1000 samples. Average is 0. Standard deviation is 1. And normal distribution.
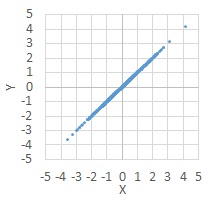
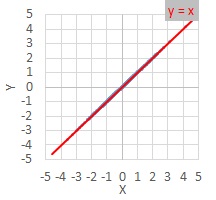
If "Y = X", plots are on the straight line in the
2-Dimension Scatter Plot
.
The formulation,
---(1)
is calculated by
Single Regression Analysis
.
Data table is the examples of 3 samples in the 1000 sample.
Make data with measurement errors.
The measurement errors are that average is 0 and standard deviation is 1.
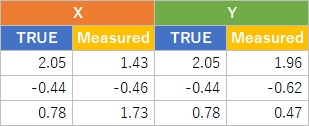
There are "X and Y" and "True and Measured".
There are 4 types of combination of them.
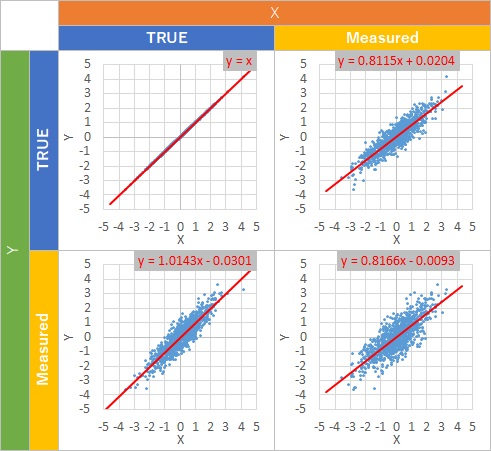
Common of those 4 is that intercepts are near 0.
There are 2 types of slopes.
One of them is almost 1. It depends on X is TRUE.
The other is almost 0.81. It depends on X is Measured.
TRUE slope is 1. But if X is Measured, the output of regression analysis is not good.
General data includes measurement errors. It means that "Regression analysis finds the lower slope formulation generally."
The example above is using measurement errors.
There is simpler example that regression analysis does not go well.
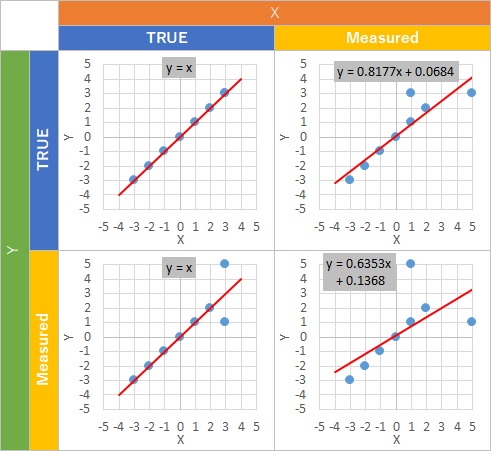
In this example,
---(1)
is the best output.
But there is the case that lower slope is the output.
 ---(2)
is used as the model of
Single Regression Analysis
.
The part, "E" is needed to include the dispersion of the data from the strait line.
In this formulation, measurement errors of X is not considered. So if the data of X includes measurement errors, wrong output is calculated.
NEXT  Regression analysis of Proportional variance
