 .
.
If Y is one and X is one, the Regression Analysis is called "single regression analysis"
If X variables are more than two, it is called " Multi-Regression Analysis ".
By regression analysis, we can study the number of A and B.
And we can study the relation between Y and X and the
 .
.
Least square is the famous way to get the formulation.
Finding the coefficients of the equation completes the equation. A typical method of finding the coefficients is the least squares method. In addition, there is also the maximum likelihood method.
Using this method, you can find a plausible A or B value for the data you have.
The validity and validity of an expression is evaluated by the correlation coefficient and contribution factor.
We evaluate fitting with correlation coefficient. Coefficient of determination is square of correlation coefficient. And coefficient of determination is often expressed with percentage.
The plausibility of the obtained expression is determined by the contribution rate. The contribution factor is also known as the coefficient of determination.
As mentioned in the name of "contribution rate", Since the contribution factor is "the rate at which the regression equation can explain the variation of the objective variable", it is used as an index of the explanatory ability of the regression equation. If the contribution rate is not high, You can't use regression equations for predictions, or slope or intercept numbers as numbers to represent the current state.
Below is a graph of X and Y, and a graph of X and E. E is the value obtained by subtracting the regression equation from Y. The contribution is R2, but R2 of 0.832 indicates the percentage of the linear portion of the regression equation of the variation in the overall Y equation. The remaining variation is the variation of E.
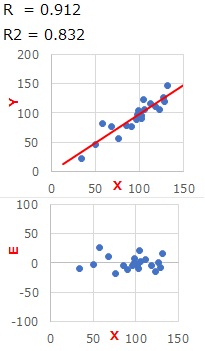
By the way, even if the correlation coefficient is squared, the contribution rate can be determined.
Contribution is an important measure in causal Making Hypothesis by Correlation.
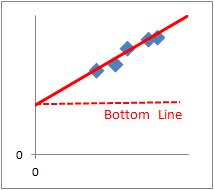
A is called the slope.
B is caaled the the intercept.
We study the relation between X and Y as the set of A and B.
In the analysis of energy and costs, B means the bottom line. The way to reduce A and B is the efficient improvement.
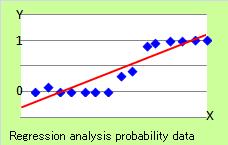
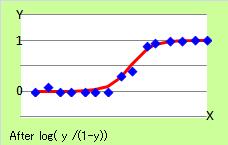
If Y is the probability data, general regression analysis does not work well. The regeression line does not show the character of probability data. The straight is not good.
By the change,
log( y / (1-y))
as the new y and we use it for regression analysis, we may get a good output.
If Y is 0 or 1, for example, we should use 0.0000000001 or 0.99999999999 as the Y. The change may work well.
If you know the change, it is easier to learn Logistic Regression Analysis .
A typical simple regression analysis uses the following formula:

A distribution where this fits perfectly is the one shown in the graph below. A is called the tilt and b is the Y-intercept. E stands for variation. In this model, the longitudinal variability is constant.
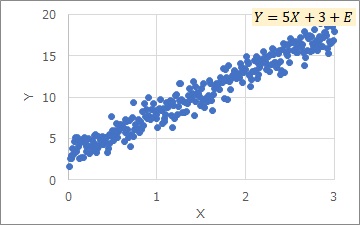
E = Y - 5X - 3
, then E is obtained. E is called the residual.
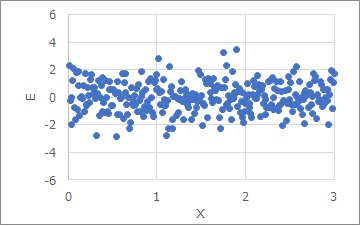
The graph of the residual E shows the figure below. No matter how many X you have, the variation of E is about the same. This is called "constant variance".
On this site, you will find a page on Regression analysis of Constant variance.
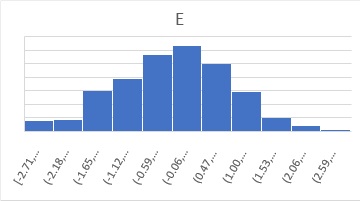
Another characteristic of residual E is its normal distribution. A typical regression analysis assumes that the residual E is not only homodispersive, but also normally distributed. For example, the histogram of E above is shown in the figure below and is normally distributed.
For more information on residuals other than normal distributions, see Generalized Linear Model page.
NEXT 

 Regression Analysis for Curve
