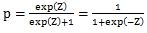
If we put Z as the left side of the formulation, we do the general multi-regression analysis . If we put p as the Y-axis we get the curve line.
Logistic Regression Analysis (LRA) is the analysis when Y is category data. For example, "ON" and "OFF". The name includes " Regression Analysis ". But LRA is different from the general regression analysis.
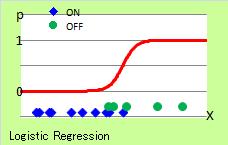
The figure is LRA. The curve shows the "Probability to become "ON" or "OFF". p is the probality of "OFF". 1-p is the probability of "ON".
The dot is the scatter plot of "ON" and "OFF".
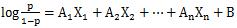
The formulation of LRA is
If we put Z as the left side of the formulation, we do the general
multi-regression analysis
.
If we put p as the Y-axis we get the curve line.
We use "ON" and "OFF" as Y. The formulation between p and X is calculated by the Y.
We can do the handmade LRA.
We make sections for X.
Then we calculate p for each section.
And then we change p into

If p is 0 or 1, we cannot change. In these cases, it is better to use 0.00000000001 or 0.999999999999 as the numbers.
After you get the number of A and B, the curve line is
The example is "ON" and "OFF" in this page. If the Y is the category data having opposite meaning, LRA is good to analyze.
If the Y is "Tokyo" and "Paris", even if we have two category, the phenomena include more categories. For this case, LRA is not good as analysis method.
The basis of logistic regression analysis is a two-choice question, but there are also logistic regression analysis that can handle three or more choices.
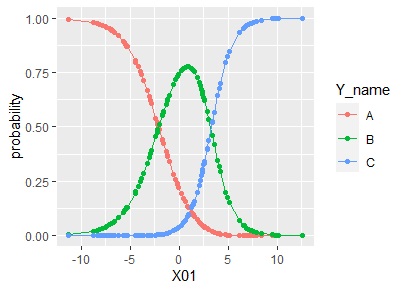
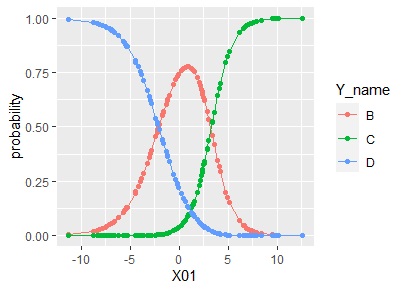
Multinomial logistic regression analysis is used for classification problems with three or more choices. The graph below shows the data on the left and the results of the multinomial logistic regression analysis on the right.
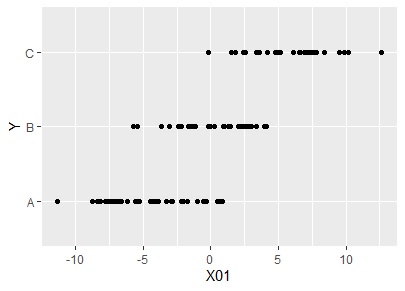
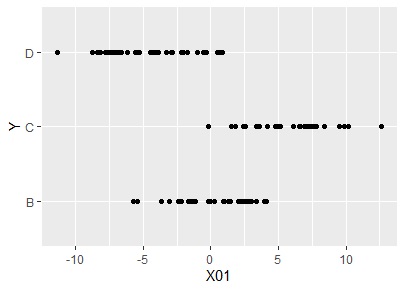
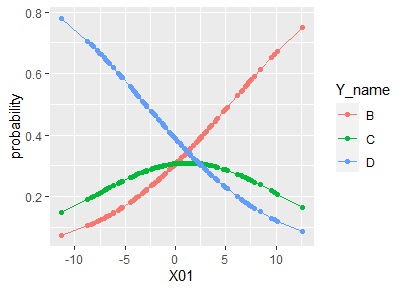
Ordered logistic regression analysis is when the three categories are ordinal scales such as "good, neither, bad". The graph below shows the data on the left and the results of an ordinal logistic regression analysis on the right.
In ordinal logistic regression analysis, the order of the names represents the order, so for example, in the above data, changing "A" to "D" will change the resulting graph.
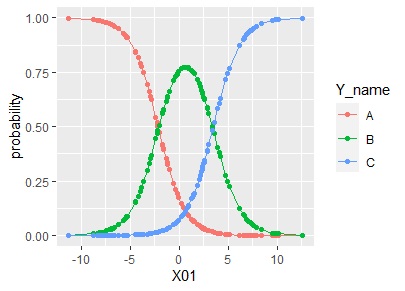
By the way, in multinomial logistic regression analysis, changing "A" to "D" does not change the appearance of the resulting graph.
Logistic regression analysis is included in various software for statistics and machine learning. Probit analysis can be done with R, but I don't remember seeing it with other software.
Logistic regression analysis by R
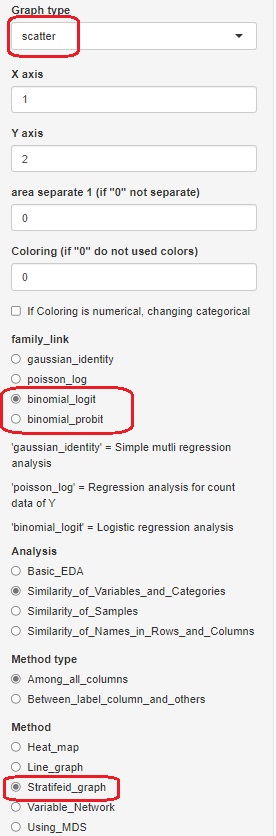
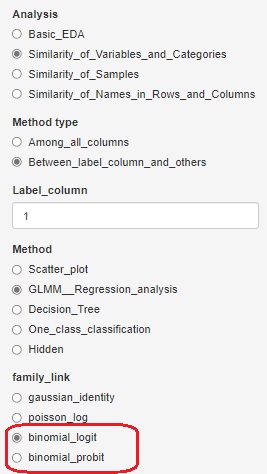
R-EDA1 does not have items such as "logistic regression analysis" and "probit analysis", but as one of the functions of the generalized linear mixed model (GLMM) , logistic regression analysis and probit analysis can be performed. I have. In "family_link", select "binomial_logit" for logistic regression analysis and "binomial_probit" for probit analysis.
GLMM is included in each of the tools for drawing scatter plots and for examining the relationship between one variable and all other variables.
Difference of Good Distribution by Methods
Difference of Output by Methods

