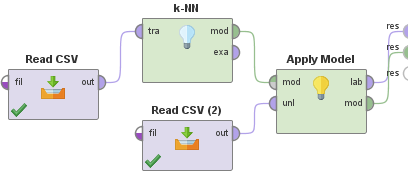
The right figure is the part of RapidMiner.
In Difference of Good Distribution by Methods, "favorite distributions" is the point of view.
In this page, "output" is the point of view. This is the important point when we use these methods for prediction.
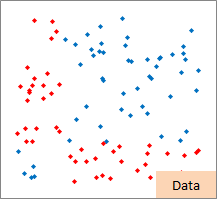
I used MS-Excel to make sample data and graphs. And I used RapidMiner to use methods. Sample file is an example.
In this page, I do not use MT method because RapidMiner does not cover this method.
The right figure is the part of RapidMiner.
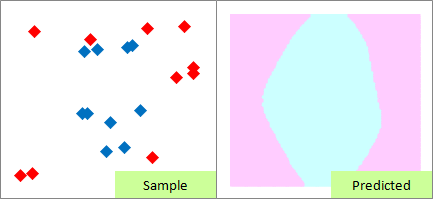
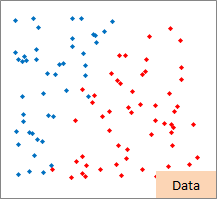
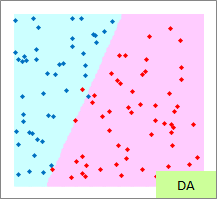
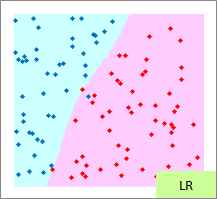
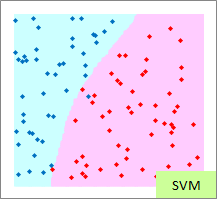
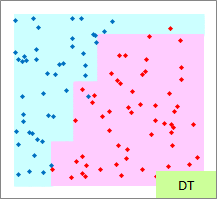
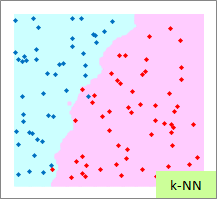
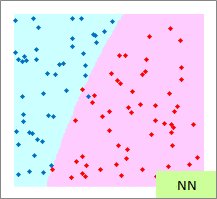
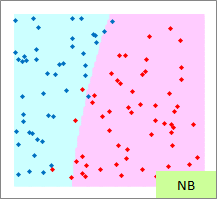
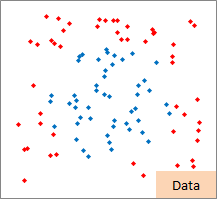
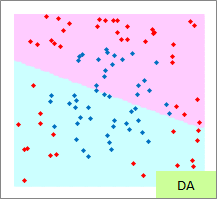
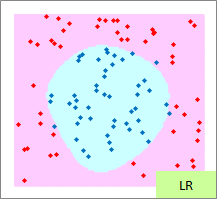
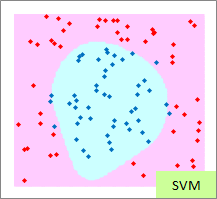
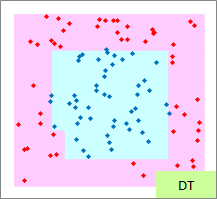
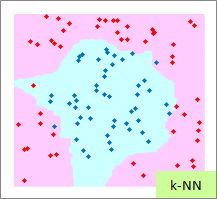
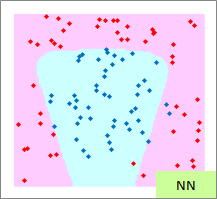
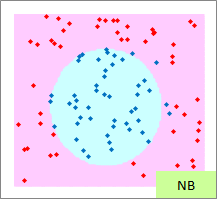
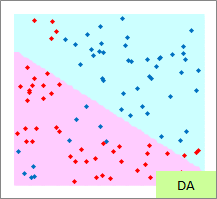
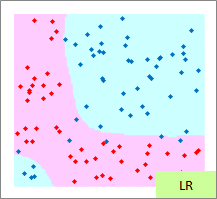
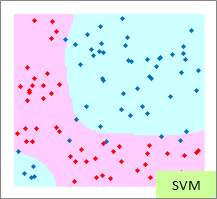
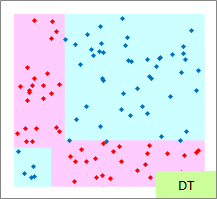
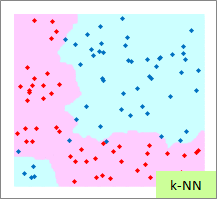
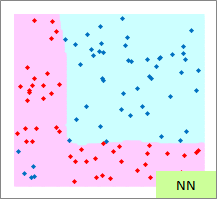
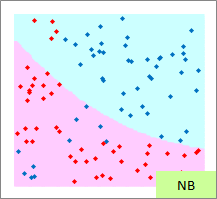
Red points are "-1" in the sample data.
And blue points are "1".
Light red parts are the area predicted as "-1". Light blue parts are as "1".
In RapidMiner, Kernel Function can be used for Logistic Regression Analysis. So the methods are not same explained in the page, Difference of Good Distribution by Methods.
The best methods are changed when purpose or data are changed.
NEXT  Analyzing variable companioning
