 Classification tree and regression tree
Decision Tree is a method to find particular area in data set.
Multi-Regression analysis cannot find partial abnormality, but regression tree can find.
If Y is
Category Data,
the name is "Decision Tree".
Or if Y is quantity data, the name is "Regression Tree".
When I call both methods together, I say "Decision Tree" in this site.
There are many references of decision tree for marketing because it is useful to classify customers. But it is also useful for general use because it can put in order the diversity of phenomena.
There are many algorism of Decision Tree. One of them uses information criterion to build the tree.
At first, it is difficult for us to understand that "What the tree means?" and "How the tree is made?"
Explanations below are to build image of Decision Tree.
Result of Decision Tree is not easy.
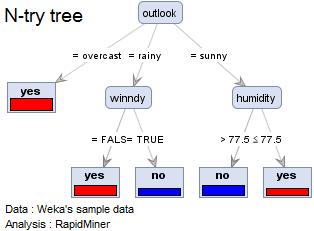
"Yes" and "No" are Y in the right graph. This analysis is to find the strong factor that changes the select.
The first (strongest) factor is "weather". The second is "humidity" in the case of "sunny" and "windy" in the case of "rainy". The difference is important.
We can find such factors automatically.
The strong point of decision tree is that it analyzes the difference of effective variables for each category. And "automatically" is one of the strong points. If we use Multi-variable analysis for such use, we have to do Stratified Sampling politely.
The weakness of categorization methods (e.g. SOM and Cluster Analysis ) is that the reason why these methods make the categories is often unknown.
When we put the categories made by these methods on Y of decision tree, we may study the reason.
First branch affects the next branches. If main variables are more than two or if there are some remarkable data, the analysis may fail.
We often want to study that the case if the variable of first branch is changed.
Easy measure is that to remove the variable of first branch and remake the tree.
Random forest is a kind of decision tree. It uses all variables to make a tree. It uses the sets of variables sampled randomly. And make some trees.
We think the structure of data totally by the trees.
The number of branches has two types, "two branches" and "more than two branches (N-try tree)". The algorism of "two branches" is easier.
Some people say that the result of "two branches" and "more than two branches" are same mathematically. But I do not think so.
If we want to link the result of decision tree and Stratified Sampling Analysis , "two branches" is not useful. In "two branches", often a X factor appears some number of times on different level of the tree, it makes difficult to interpret the relationship between the tree and the mechanism of the phenomena.
If we can re-construct the result of decision tree to adapt human recognition structure, "two branches" will be more useful.
Difference of Good Distribution by Methods
Difference of Output by Methods
NEXT Classification tree and regression tree
