 There are various HT methods for statistical values (average, deviation and so on).
These methods use different process.
But the final step is similar.
On the final step, the diagram like in this page is used to judge.
There are various HT methods for statistical values (average, deviation and so on).
These methods use different process.
But the final step is similar.
On the final step, the diagram like in this page is used to judge.
Average is often used to compare categories. But if unevenness of data is large, the difference of average may be an accident.
Graphs of Disribution are useful to check the reliability. But if there are not many samples or the difference is very small, the visual checking is difficult to judge.
In statistics , hypothesis testing (HT) is used to check the reliability mathematically.
There are various HT methods for statistical values (average, deviation and so on).
These methods use different process.
But the final step is similar.
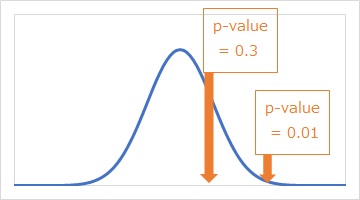
On the final step, the diagram like in this page is used to judge.
If the value we want to judge is in the area of comparing data, the value is a group of comparing data.
The level of judgment is called "significance level".
The index of significance is P-value (provability value).
0.05 (5 percent) is often used as the significance level.
The idea of judgment is that
"P-value is less than 0.05."
= "The phenomenon is difficult to predict."
= "The difference is significant."
If there are many samples, P-value likes to be small value. So the number of samples affects the judgment.
Even if there is a significant difference, it is not useful. So after the judgment, we need to judge the volume of the difference.
There are functions to calculate P-value in spreadsheet software. If there are many variables, P-value is useful to pick-up suspicious values. Small P-value means that we should study details of the variables.
This idea it a basic idea of Decision tree .
In the real work of SPC(Quality Control) , hypothesis testing of the difference of average is often used. It is called "t-test."
T-test is used to compare two average of two groups.
ANOVA is also for more than two average. Paired t-test is used if there is "pair" information.
Parametric testing uses the condition of normal distribution. In my experience, parametric testing is useful for almost all analysis.
But sometimes, we cannot use normal distribution as a condition. So we need non-parametric testing.
Non-parametric testing uses the distribution of plus and minus, the order and median. For the situations, "Average is not important as the group data", "We can estimate the order but we cannot estimate concrete (quantity) numbers" , non-parametric testing may be useful.
Strength and Weakness of Big Data
NEXT  Type I error and Type II error
