Hypothesis testing for diffrence of average is the most used hypothesis testing in SPC .
Basic way of this testing is for the difference between 2 groups.
There are 2 methods, Student's t-test and Welch's t-test.
Student's t-test needs "variance is equal". But Welch's do not need.
In Excel, ttest function is for this test.
setwd("C:/Rtest")
Data <- read.csv("Data.csv", header=T)
t.test(x=Data$X1,y=Data$X2,var.equal=T,paired=F) # Student's t-test
setwd("C:/Rtest")
Data <- read.csv("Data.csv", header=T)
t.test(x=Data$X1,y=Data$X2,var.equal=F,paired=F) # Welch's t-test
ANOVA is used for the case that more than 3 groups. Paired t-test is used for the paired data.
These methods have other use.
I think
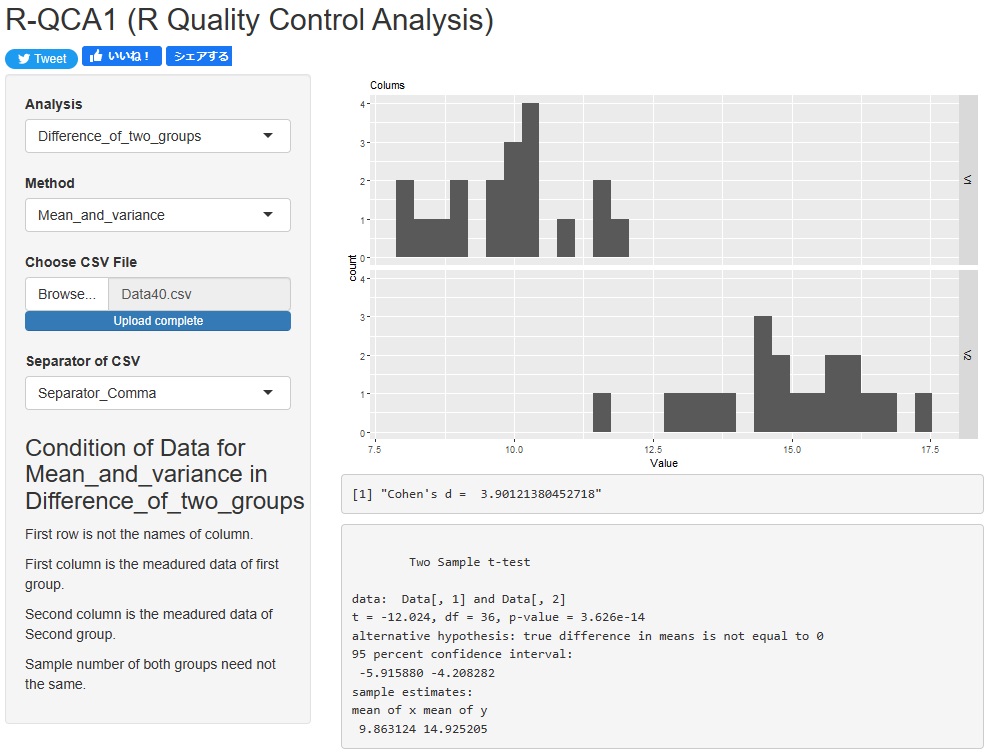
R-QCA1
is a good way to compare Before-After . You can prepare and read a csv file that contains the data of the group you want to compare in the first and second columns.
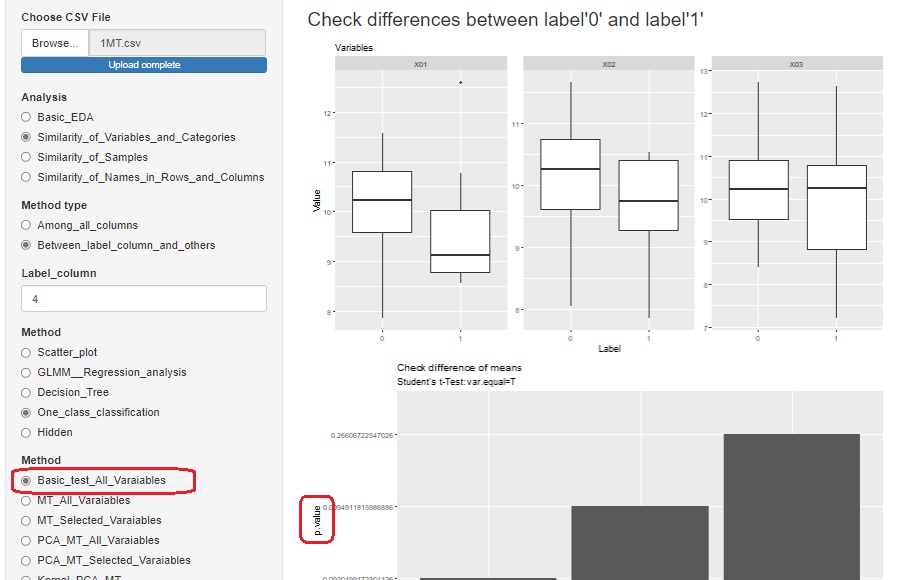
In
R-EDA1
, if you select "Basic_test_All_Varaiables", each variable is stratified based on the variable of the label, and for all the variables, the difference between the average values of the groups with labels 0 and 1 can be tested. .. Only the p-value is output.
NEXT  Reinforcement the test in the meaning of difference
