https://ecodata222.shinyapps.io/R-EDA1/
There is a story about EDA for practical use on the EDA page , but R-EDA1 is free software made so that anyone can easily do such EDA.
You can use it for free.
Open the link below to launch the software. Since the software runs on the server provided by Rstudio, there is no need to install your own computer. (There is no such thing as "It doesn't work well on my computer!") There is no such thing as "registering an email address".
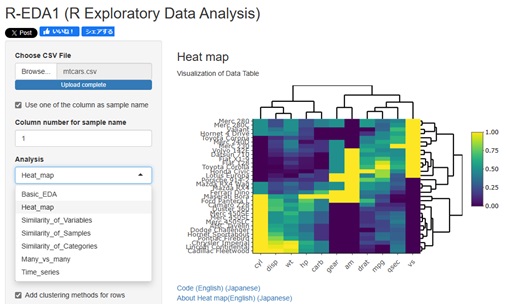
From the software, just open the csv file containing the data and select the analysis you want to do. It's software that uses R, but you don't have to write the R code yourself.
https://ecodata222.shinyapps.io/R-EDA1/
Data analysis manuals explain techniques such as regression analysis and principal component analysis. In practice, in addition to these methods, we will combine the process of converting qualitative variables into quantitative variables and the graphing of output. This software is organized by frequently used combinations.
At the restaurant, I'm trying to make it feel like selecting the "Noodles" page and then selecting "Nabeyaki Udon". Generally, the contents of the data analysis manual are "how to make udon" and "how to make soup stock", so it takes time to get to what you want to do.
If you don't mind spending weeks or months, you may want to take the time to develop your analysis plan and code, but the R-EDA1 is used during emergency response meetings. It is also assumed that you want to get the analysis result in the meeting.
In the explanation of data analysis, it is common to classify methods from the viewpoints of "supervised learning / unsupervised learning" and "objective variables are quantitative variables / qualitative variables".
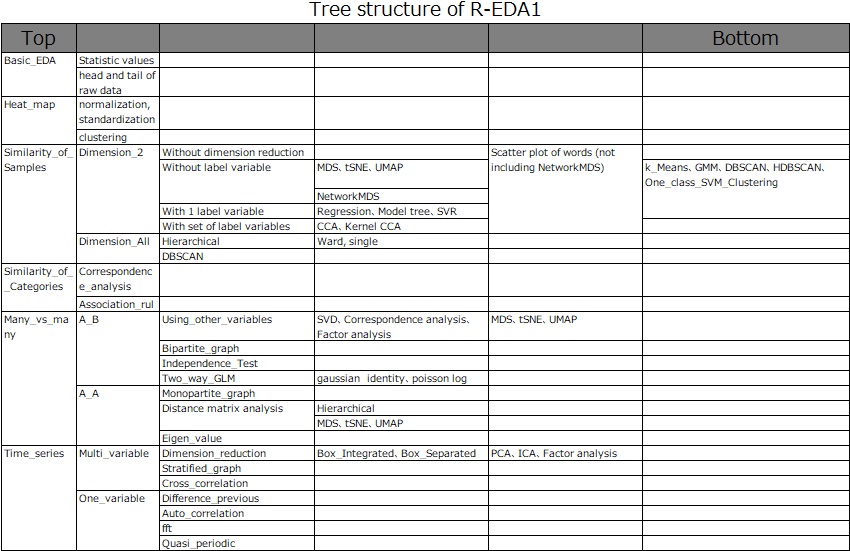
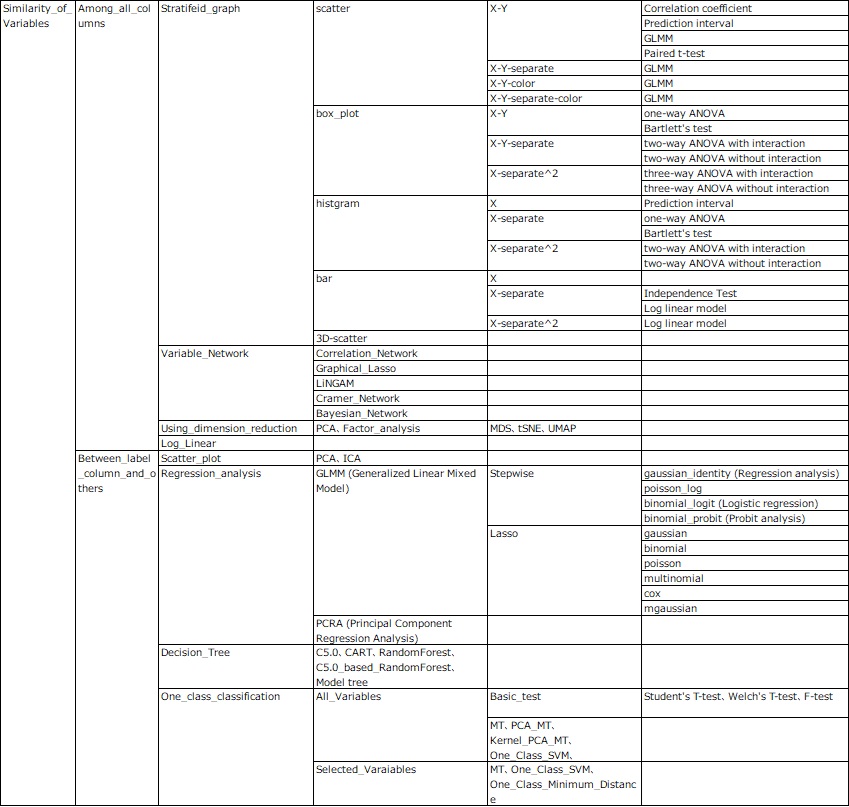
Since the R-EDA1 method is a collection of EDA recipes, it is not designed to select individual materials such as "regression analysis" and "principal component analysis" independently. Most of the recipes are pre-processed, a combination of multiple models, and a set of graphs.
From the perspective of tabular data, we first classify it into three major categories. "See the similarity of column items", "See the similarity of row items", and "See the similarity of row and column items". "Category similarity" is an application of "column item similarity".
It's a small story, but in this app, when using a method that assumes quantitative variables, qualitative variables are dummy-converted so that they can be used as quantitative variables. On the other hand, when using a method that assumes qualitative variables, quantitative variables are used as qualitative variables by one-dimensional clustering . (By default of this app, the range of numbers is divided into 5 and each is made into a category.)
This transformation makes it possible to analyze a mixture of quantitative and qualitative variables. Also, if you work with data that is not the type that the method originally assumed, you will be able to analyze more. For example, a method that assumes quantitative variables is not good at dealing with non-linear relationships of quantitative variables, but a method that assumes qualitative variables makes it possible to analyze non-linear relationships as well.
The main body of R-EDA1 is on the free server provided by RStudio. The calculation time is basically determined by the capacity of this server.
I still don't know what happens when multiple people use this tool at the same time.
If the scale of sample data (iris etc.) in R etc. is large, the calculation time will not be a concern, but if it is data of several thousand lines, it will wait for a few seconds. If it is too large, the calculation may stop. If the csv file is large, the data communication time will take some time.
If Rstudio is installed on your PC, you can also say "Run on your PC". Enter the following two lines into the Rstudio Console to start R-EDA1. If you run it on your own PC, an error will occur if there is a library used by R-EDA1 that is not installed. The error message tells you which library is missing. If you don't have one, you need to install it. At first, I think that there are multiple things that are not libraries, so I think that the work of "Error --> Installation" will be repeated.
library(shiny)
runUrl( "https://data-science.tokyo/R-EDA1.zip")
We have the code on GitHub, so you can also download and use the code. Load either ui.R or server.R in Rstudio and it will start.
https://github.com/ecodata22/R-EDA1
* Shiny should be able to start with the code of GitHub without downloading, but for some reason I can't.
The input data is only a csv file. In Excel, you can create it by selecting "csv" when saving.
Also, although the details are written in the software itself, if the data shape is different from what the software expects, an error will occur or it will take an abnormally long calculation time. For example, if qualitative data is mixed in a quantitative variable, it will be judged as a "qualitative variable" and will be a qualitative variable with a huge number of categories, so the calculation time will be abnormally long.
Release notes is in the page, R-EDA1 release notes.
