EDA stands for "Exploratory Data Analysis".
The word "EDA" has long been used in the field of Data Mining . It refers to the task of carefully examining the data before creating a model for Regression or Label Classification.
Careful examination will ensure the validity and accuracy of the model.
What is commonly described as EDA work is as follows:
The general explanation of "EDA" is as described above, but this is not enough for EDA when actually creating a predictive model for issues in the world. We will analyze more various data.
On a different note, "Data Mining" is a type of exploratory data analysis. Cause and Effect Analysis , such as "I want to investigate the relationship between the cause and effect of what is happening from this data," is also exploratory data analysis.
Exploratory data analysis is a method of analyzing tabular data (table data, table data) regardless of whether or not a predictive model is created.
This page is an introduction to various approaches. There is a detail page for each approach.
It is basic to look at the statistics for each variable and the number of data.
Also, the whole table may be difficult, but for the first and last 5 rows, etc., look at the raw data and check the number of digits in the data.
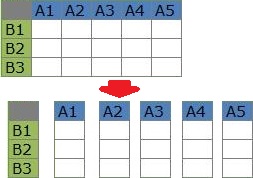
Analysis of variable similarity focuses on the relationships between the items in the columns of the table.
In the table below, for example, find out that "A1 and A2 are similar, but A1 and A3 are not."
The basic method is to look at a two-dimensional scatter plot for a combination of two variables in a basic way.
Since EDA is explained above as "work before creating a model for regression and label classification ", it is complicated, but regression and label classification methods can be used as a kind of EDA method. I can do it. One of the EDA methods is to examine the relationship between variables.
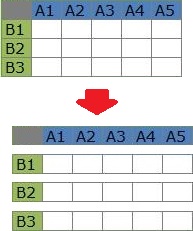
Analysis of sample similarity focuses on the relationships between the items in the rows of the table.
In the table below, for example, find out that "B1 and B2 are similar, but B1 and B3 are not."
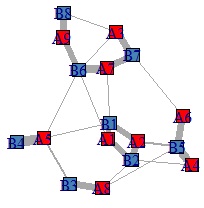
Many-to-many analysis focuses on the relationship between table row items and column items.
From this approach, you can also proceed to the analysis of variable similarity and the analysis of sample similarity.
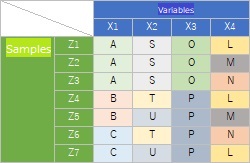
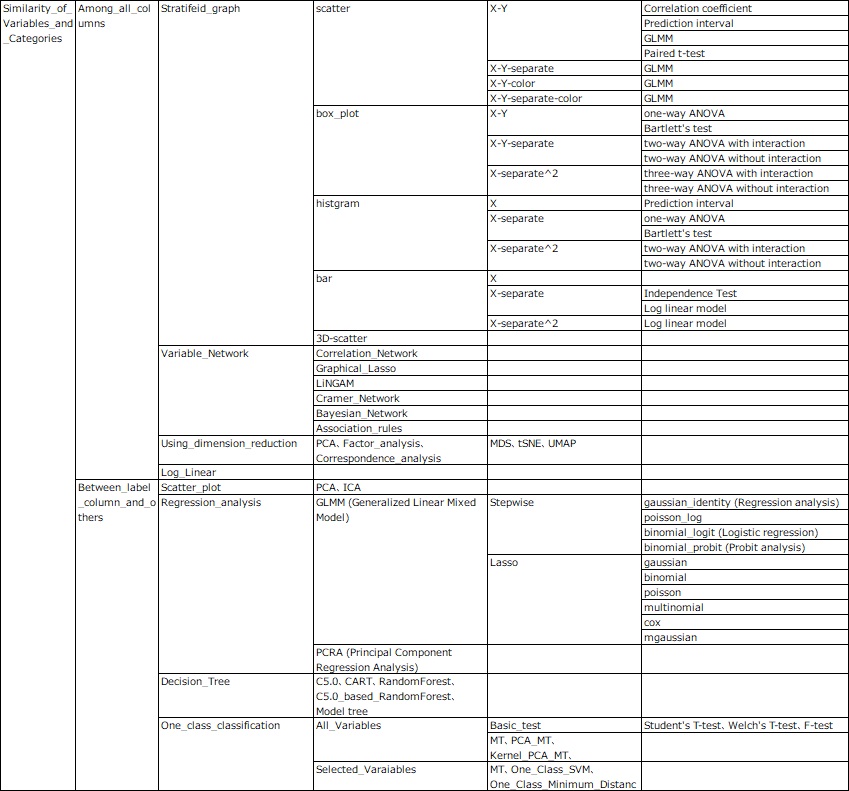
Analysis of similarity between individual categories focuses on the relationships between the categories within the qualitative variables. Table row and column items are less important.
In the table below, you can see, for example, "A, S, O are often together. B is always with P, but P is not always with B."
By dummy transforming a qualitative variable, the method of analyzing the similarity of variables can also be used for this analysis.
One-dimensional clustering of quantitative variables also allows you to analyze the data of quantitative variables from the perspective of analyzing the similarity of individual categories .
Time series analysis can be broadly divided into two types.
Often the order of the data is in chronological order, but the first is an analysis that looks at the characteristics of this order. A line graph is basic, but when you process the data, what you see in the line graph changes in various ways.
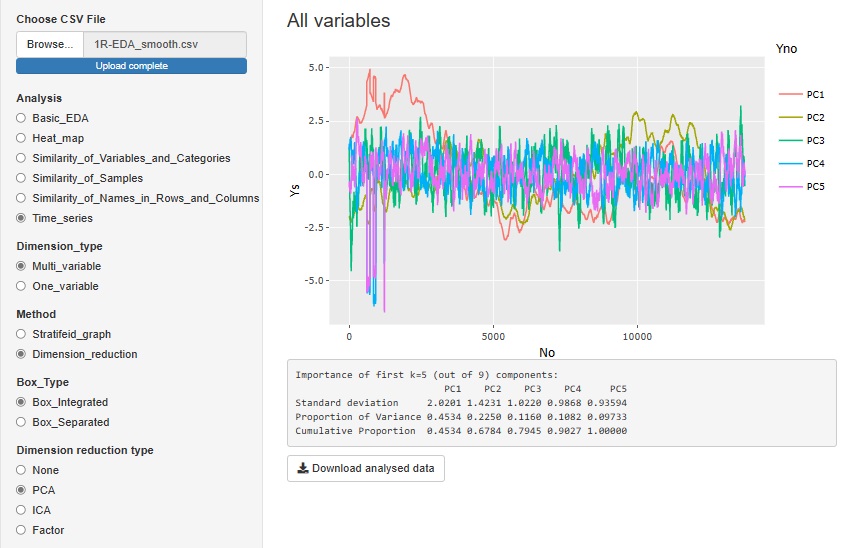
The second method is to investigate temporal characteristics based on time data. This analysis is more specialized than EDA because it looks at the nature of the data such as the phenomenon and time.
It is a technique that can be used with numerical data, but it is made into a Heat map to visualize the entire table of data.
You may be able to see the characteristics of how the data is arranged.
A better understanding can be obtained by looking at the heatmap after cluster analysis and standardization .
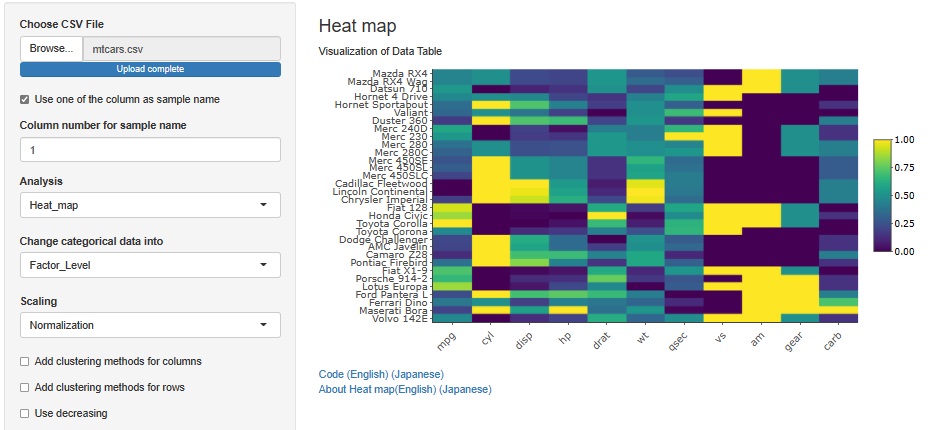
For relatively small table data, heatmaps alone can be used to analyze variable similarity , sample similarity , many-to-many , individual category similarity , and time series analysis all at once . increase. It can also be used as a supplement to these methods.
R-EDA1 is free software that makes it easy for anyone to use EDA that I have used in my practice. I also use it myself.
It is based on R, but can be used with no code (no programming). No installation or registration is required.
R-EDA1 starts when you access https://ecodata222.shinyapps.io/R-EDA1/ .
Detailed explanation can be found on the page of the Web application R-EDA1 .
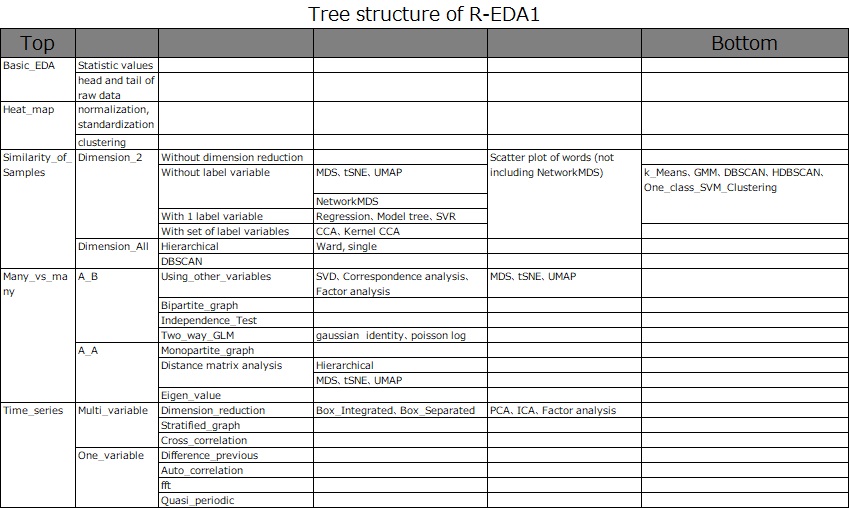
This page is the top methods of R-EDA1. R-EDA1 has the structure of methods of below.
NEXT  Decision Tree
