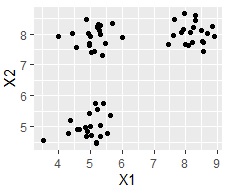
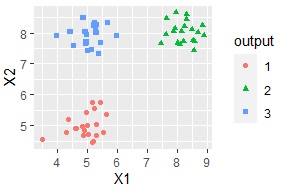
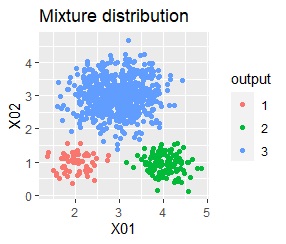
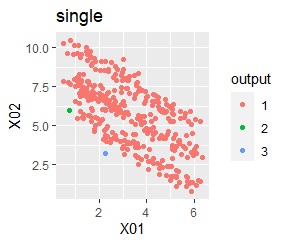
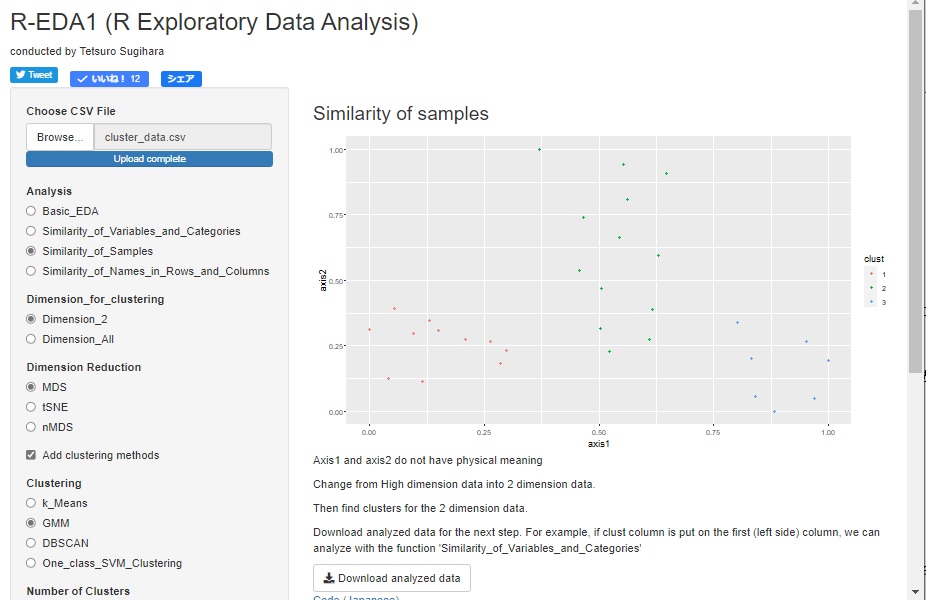
Cluster analysis is a type of sample grouping analysis . This analysis allows you to create groups (clusters) of data. For example, the scatter plot on the left looks like it's divided into three groups, but if you use this method, the software will automatically group each sample for you. You can also color code using the information of the created group.
There are two types of cluster analysis, hierarchical and non-hierarchical, depending on how groups are created. It may be said that "hierarchical type is bottom-up, non-hierarchical type is top-down".
The hierarchical method is a method of looking at the distance between each sample and forming a group of close ones. A tournament table-like graph called a dendrogram is created, and this is a hierarchical graph.
Grouping is done using the information in this hierarchical graph.
Various indicators of proximity have been devised.
In the non-hierarchical type, instead of grouping by the closeness of individual samples, each group is decided globally.
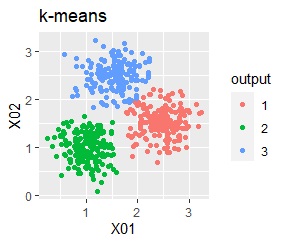
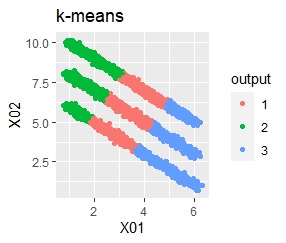
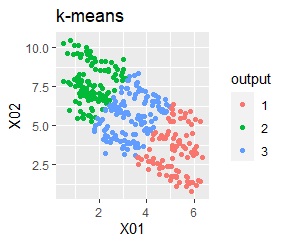
In the k-means method, for example, if the analyst specifies "k = 3", the sample is divided so that there are three groups.
The X-means method is similar to the k-means method, except that it automatically determines k.
However, it doesn't seem to be as many as I expected. In the example using R below, it is ideal to be "3", but it is now "8".
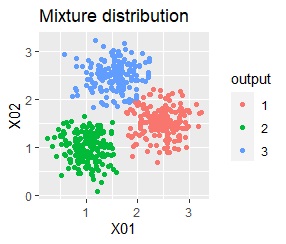
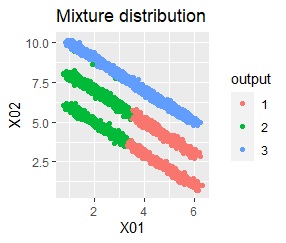
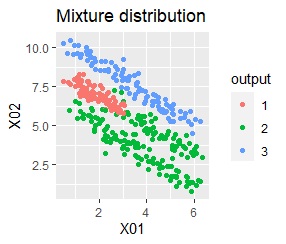
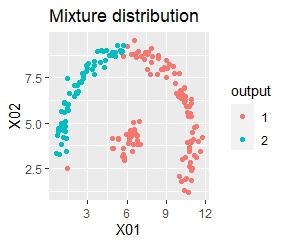
In the k-means method, samples that are clearly near the center of the group and samples that are far from the center are treated in the same way. However, it may be helpful to be aware that distant samples may also belong to other groups. At this time, if you use a mixture distribution , you can stochastically know the possibility of belonging to multiple groups .
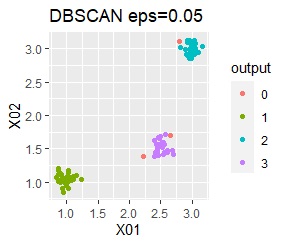
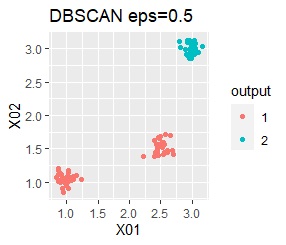
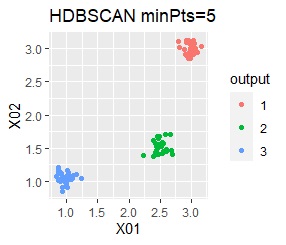
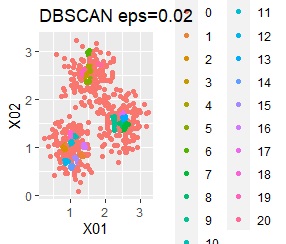
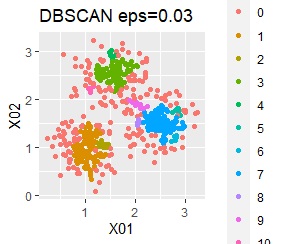
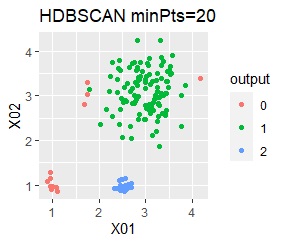
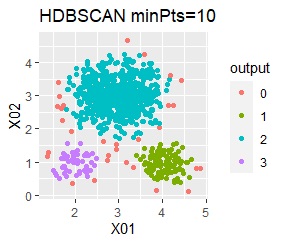
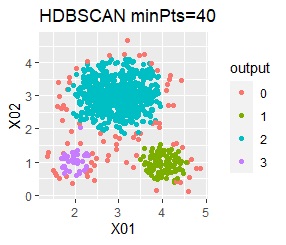
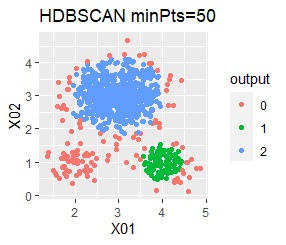
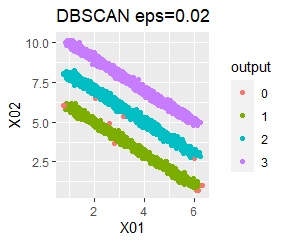
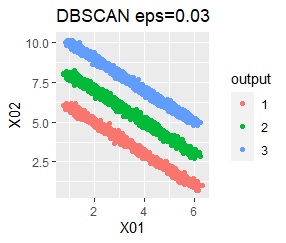
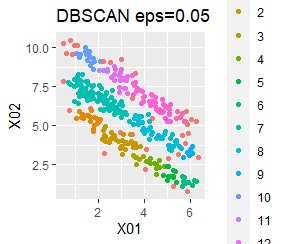
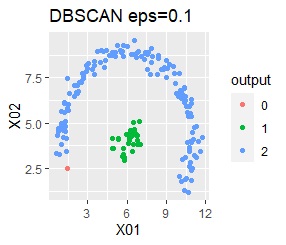
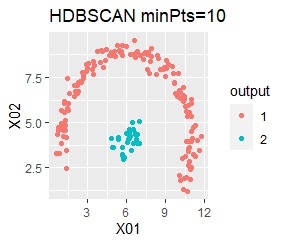
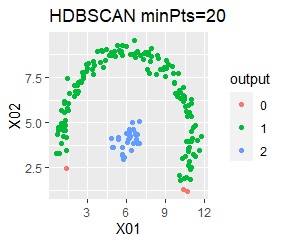
DBSCAN groups by density, so there is no central point for groups. Therefore, it can handle complicated forms .
There is another feature, and it also judges that it is a "sample that does not belong to the group" .
It is difficult to set the parameter eps when there are 3 dimensions or more, or when the unit is different for each variable. As a workaround, use the formula
(x --min) / (max --min)
to fit each data into 0 to 1 data using the respective variables max and min. This way, even if you don't know what the data is, you don't need the converted data with eps greater than 1. I think that eps should be set to about 0.1 to 0.3 as the size of the group that can divide the data space to some extent. This will improve the DBSCAN problem.
Below is the code from the Cluster analysis by R.
This is a summary of how the difference in method appears for the difference in data for two-variable (two-dimensional) data. See if the cluster analysis method can also extract the differences in groups that people can see when making a scatter plot.
To make DBSCAN easier to use, the data is normalized and then analyzed.
The conclusion is follows.
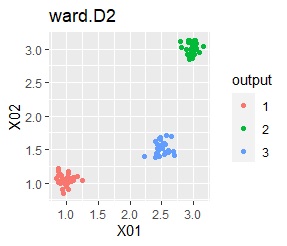
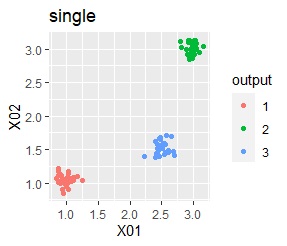
There are three groups. The variability is about the same.
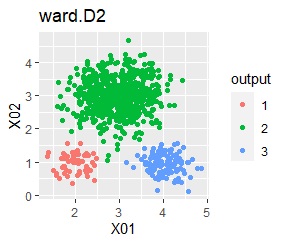
In the hierarchical type (ward.D2 and single), k-means method, and mixture distribution method (Mixture distribution), k = 3.
In the case of Example 1A, the difference in groups that can be visually recognized by any method can be extracted in the same way by the cluster analysis method.
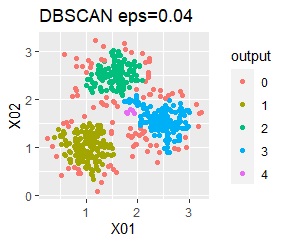
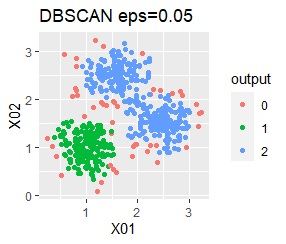
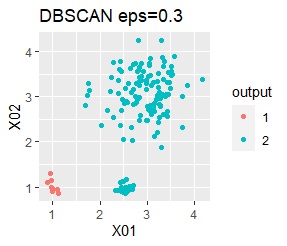
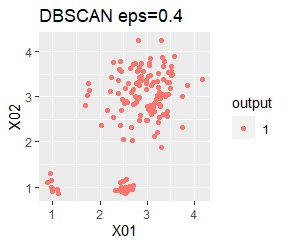
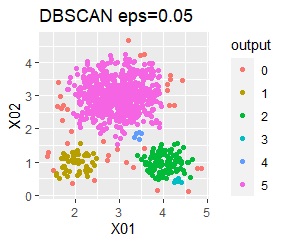
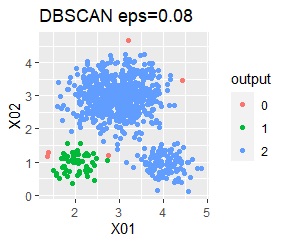
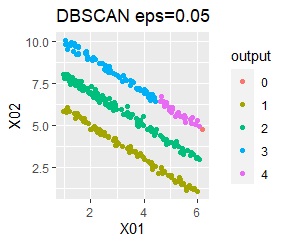
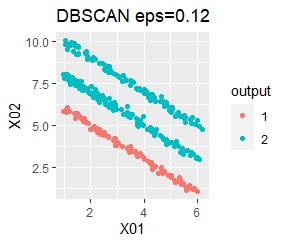
However, if eps is too small in DBSCAN, some will be judged as outliers (group of 0). If it is too large, the two groups are considered one.
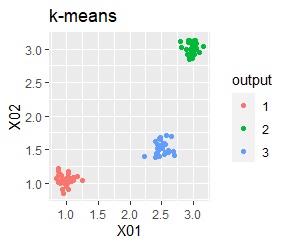
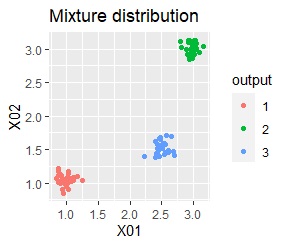

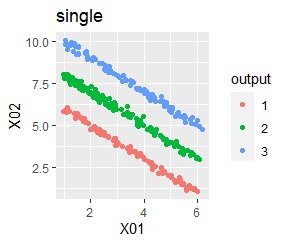
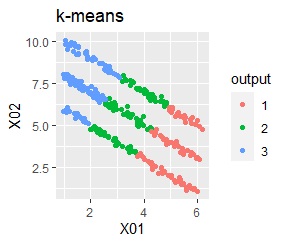
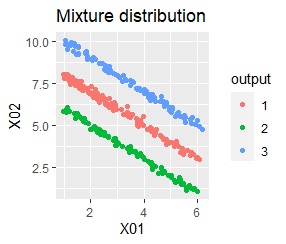
There are three groups. The variability is about the same. The difference from Example 1A is that there are multiple data near the boundaries of the three groups, and the boundaries of the groups are not clear.
In the hierarchical type (ward.D2 and single), k-means method, and mixture distribution method (Mixture distribution), k = 3.
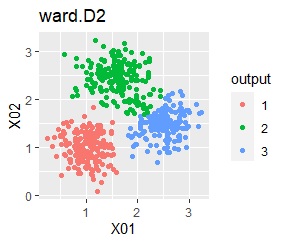
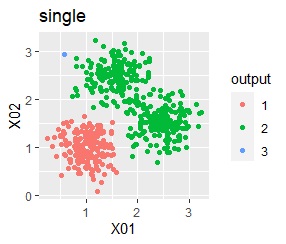
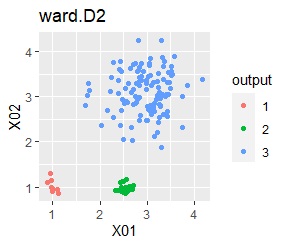
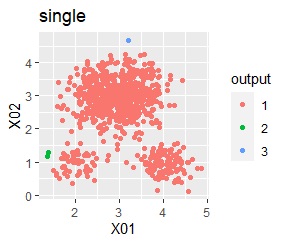
It was ward.D2, k-means, and Mixture distribution that were able to divide the three groups well. single and DBSCAN didn't work.

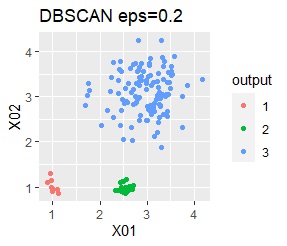
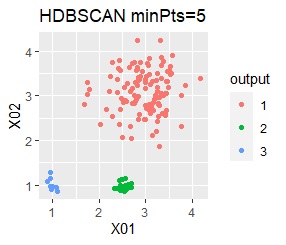
There are three groups. One group has a large variation.
In the hierarchical type (ward.D2 and single), k-means method, and mixture distribution method (Mixture distribution), k = 3.
In the case of Example 2A, ward.D2, single, Mixture distribution, and DBSCAN eps = 0.2 make an ideal judgment.
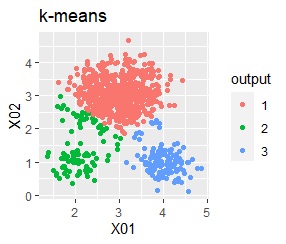
With k-means, some of the smaller variability groups are considered part of the larger ones. This comes from the fact that k-means considers all groups to be the same size. Note that in this example, this property causes poor results, but in some cases this property can also be used for analysis.
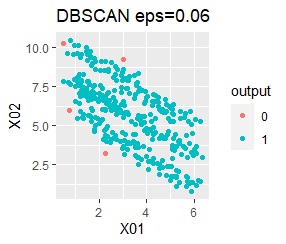
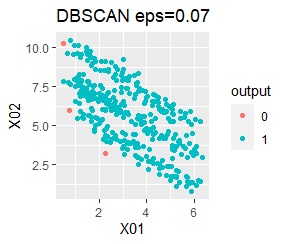
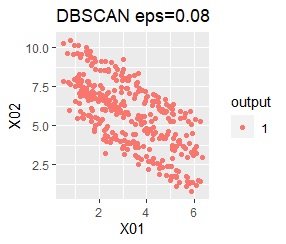
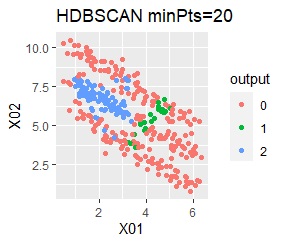
There are three groups. One group has a large variation. The difference from Example 2A is that there are multiple data near the boundaries of the three groups, and the boundaries of the groups are not clear.
In the hierarchical type (ward.D2 and single), k-means method, and mixture distribution method (Mixture distribution), k = 3.
In the case of Example 2B, ward.D2 and Mixture distribution make an ideal judgment. Other than that, it didn't work.
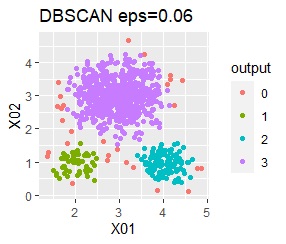
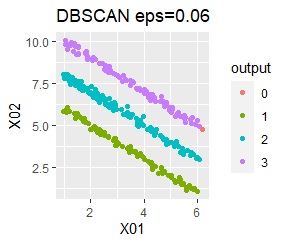
In the case of DBSCAN eps = 0.06, 3 groups are extracted and only the vicinity of the group boundary is classified into group 0. If you are not sure which group you belong to, you can handle it separately, which is useful. However, even a simple one like this example can only be put out by changing eps in 0.01 increments, so it seems that it is not a technique that can be used in practice.

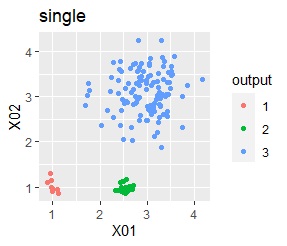
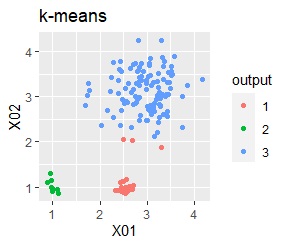
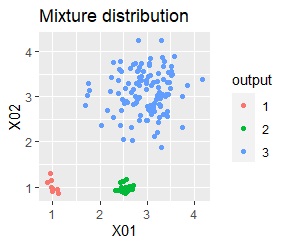
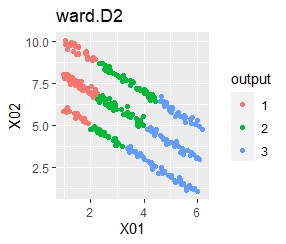
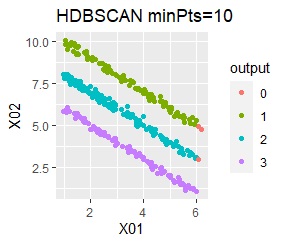
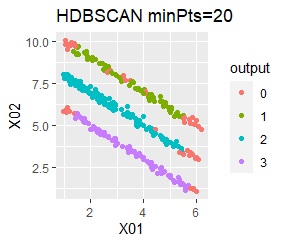
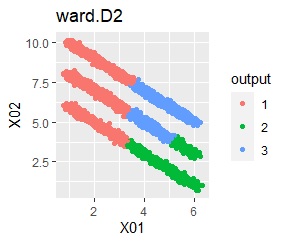
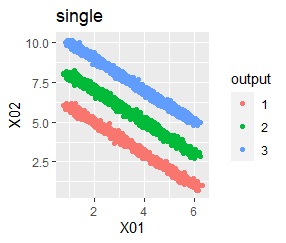
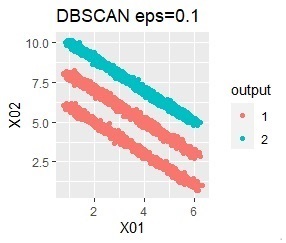
There are three groups in which the samples are lined up in a straight line. The boundaries are clear.
In the hierarchical type (ward.D2 and single), k-means method, and mixture distribution method (Mixture distribution), k = 3.
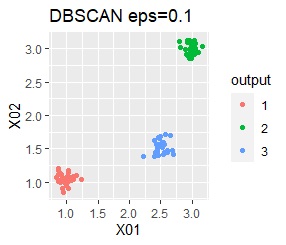
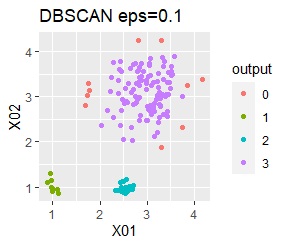
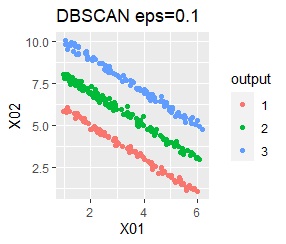
With single, Mixture distribution, and DBSCAN eps = 0.1, the ideal judgment can be made.
However, DBSCAN does not seem to be a technique that can be used in practice because the result changes considerably in increments of 0.01 for eps.
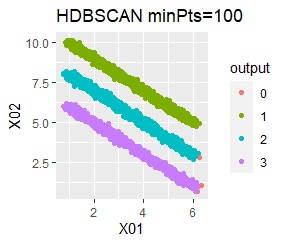
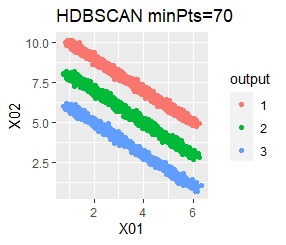
There are three groups in which the samples are lined up in a straight line. The difference from Example 3A is about 16 times the number of samples.
In the hierarchical type (ward.D2 and single), k-means method, and mixture distribution method (Mixture distribution), k = 3.
The ideal judgment can be made with single and DBSCAN. Unlike Example 3A, the Mixture distribution didn't work. With DBSCAN, the width of eps, which is an ideal judgment, is wide as it is, so it feels like it can be used in practice.


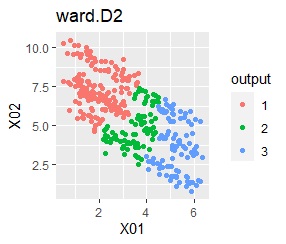
There are three groups in which the samples are lined up in a straight line. The difference from Example 3A is that there are multiple data near the boundaries of the three groups, and the boundaries of the groups are not clear.
In the hierarchical type (ward.D2 and single), k-means method, and mixture distribution method (Mixture distribution), k = 3.
It was all useless.
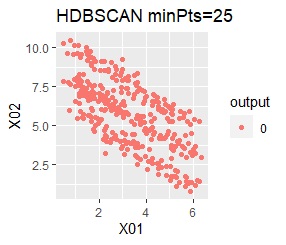
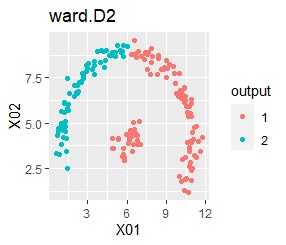
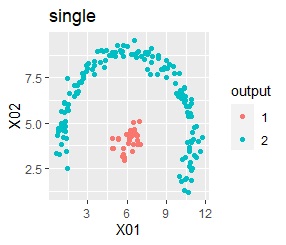
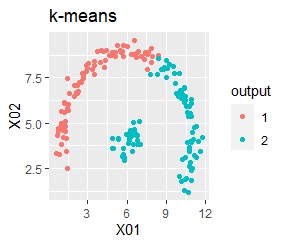
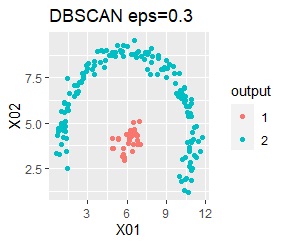
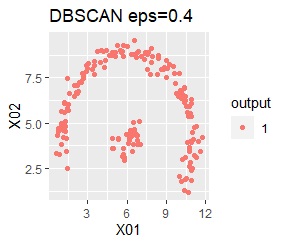
There are two groups. One group is arcuate.
In the hierarchical type (ward.D2 and single), the k-means method, and the mixture distribution method (Mixture distribution), k = 2.
I can judge well with single and DBSCAN.
It turns out that ward.D2, k-means, and Mixture distribution cannot handle specially shaped groups.


Among the methods introduced on this page, the X-means method and DBSCAN are good because the final number of groups is automatically determined, but the number seems to be the X-means method. There is a problem that it is difficult to become, and DBSCAN has a difficulty in setting parameters.
On the other hand, in the hierarchical type, k-means method, and mixture distribution method, if you specify an appropriate number of groups, each sample will be distributed appropriately. However, it is difficult to set an appropriate group. If it is hierarchical, you can estimate from the dendrogram. Also, if the data is two variables (two-dimensional) , it can be estimated by looking at the two-dimensional scatter plot .
The problem is in other cases, and there seems to be no good way.
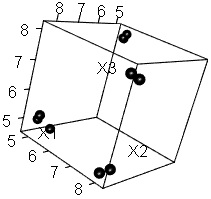
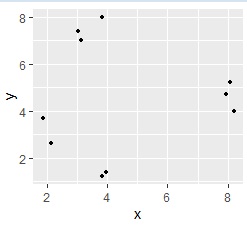
Even if there are 3 or more variables, as a method of easily estimating the number of groups using a 2D scatter plot as in the case of 2 variables , high-dimensional compression to 2D and visualization are used to analyze the data. Is possible to convert the data into two variables.
In the figure below, the data that is known to have four groups in 3D space is on the left, and the result of making it 2D with a self-organizing map is on the right. I have a clue that about 4 is appropriate.
Examples of R is in the page, Cluster analysis by R .
With R-EDA1 , you can use k-Means method, mixture distribution method, and DBSCAN. Since the data obtained by adding the clustering result to the original data can be output as a csv file, this data can be used as input data for analysis as labeled data.
For the k-Means method and the mixture distribution method, the method of making the higher dimension two-dimensional is used so that it can be represented by a two-dimensional scatter plot, and then it can be used as a method of grouping thereafter. Since it is two-dimensional, k can be determined by looking at the graph.
DBSCAN can be used for the same purpose as the k-Means method and the mixture distribution method, and can also be used as a method for grouping in high dimensions.
NEXT  Cluster analysis using 2-Dimension Scatter Plot
