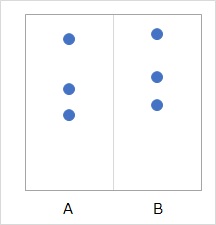
In the figure above, there are two groups, A and B, and there are three data each.
Hypothesis Testing for Diffrence of Average are typical, but in general, the method of testing that does not say "with correspondence" is the method that does not use data correspondence. Many test methods do not use correspondence. For example, if you want to calculate the average score on a test for each school and find out the difference in the average score, you don't care about the correspondence.
"If there is a response" means, for example, Regarding the scores of students in the same school in Japanese and mathematics, It is a survey such as "How much difference is the difference between Japanese language and mathematics scores for each individual?" Japanese language and math scores are handled by "individual".
Others include: This is also the case if you want to compare two instruments or compare two experimental conditions, and you have paired data.
In the figure above, there are two groups, A and B, and there are three data each.
Looking at the graph, it is very difficult to think that "B has a higher average value". If you test the difference in the mean value, the p-value will be 0.38. Normally, in the case of such data, the conclusion is that "B cannot be said to have a higher average value."
However, in fact, the above data is measured under the conditions A and B for the same person, and it is for three people. In other words, suppose there was a correspondence. Then, if you write the correspondence in the graph, it will look like the figure below.
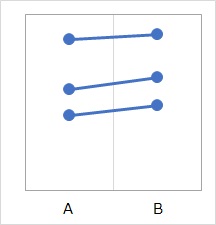
In this case, if we use the test of the difference between the paired means, the P value is 0.03, which is very small. You will be able to proceed with the conclusion that "B can be said to have a higher average value."
Looking at the mapped graph, B appears to be a bit higher for individual samples. Paired tests are a way to examine this feature.
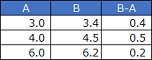
If it is true that "B is higher", then "B-A" should all be greater than 0. Paired tests examine this.
First, calculate the difference between B and A (B-A).
Commonly paired tests use the mean test to examine. Hereinafter, what we refer to on this page as "paired tests" is when using a mean test.
If you are using the mean test, We will try to find out "Can the mean value of B-A be said to be higher than 0?"
Paired tests have caveats. However, it is a caveat, not a weakness or shortcoming.
Also, if what you want to do is "find out if one group can say that the average value is higher for the corresponding data", it is not a big caveat.
one side This is an important point to note when using this test for the purpose of "finding out if one group is overall higher for paired data". For this purpose, using this test is important because it can lead to conclusions contrary to the facts, and it does not verify what you want to verify.
It is within the scope of the author's experience, but in practical data analysis, there is no case of "can be said that the average value is high". The usual case is "Can we say that it is high overall?" I would like to find out "can I say that it is high overall", but since there is nothing else that seems good, I use "Can I say that the average value is high". (Wanting to change this situation, I devised a Testing for distribution deviation.)
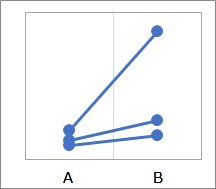
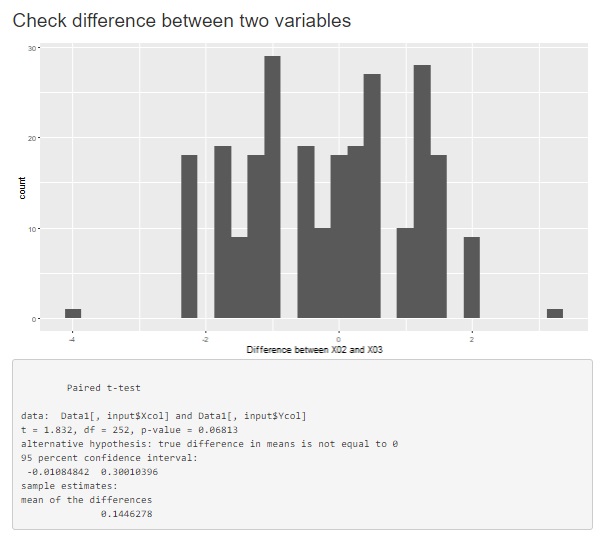
In the case of the figure above, the P value is approximately 0.13 for both paired and unpaired tests, and the conclusion is that "B cannot be said to have a higher average value."
For individual pairs, B is higher, but due to the large variability, it is not concluded that "B is higher".
This phenomenon is more likely to occur when the number of samples is small.
By the way, I actually experienced something like this example. In all cases, B is higher, but if you do a paired test, it will not be significant, so I thought, "Why?" It took me a while to realize that if the variation of B-A is large, even if all B-A are greater than 0, it may not be significant.
Paired tests are an application of the mean test and are therefore affected by the number of samples.
A large sample size makes it easier to conclude that B is higher, even if it is difficult to say that B is higher overall (for individual pairs).
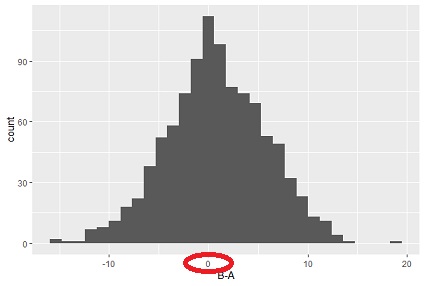
For example, the figure below shows an example of a test for the difference between paired means that B is higher. The horizontal axis is "B-A". The average value of B-A is 0.8, and the result is "It cannot be said that it may be 0" by examining "Can it be said that it may be 0?" The p-value is 0.00000017.
If you look at the graph, you can see that for 0, the number of samples on both the positive and negative sides is about the same. For this reason, even if it can be said that "the average value is higher in B", it cannot be said that "overall B is higher". If the number of samples is large, this phenomenon is more likely to occur.
As a countermeasure to the precautions of the corresponding test, After calculating B-A, the approach is to use a method other than testing the mean.
Wilcoxon's Signed Rank Test and Sign Test is a nonparametric test of paired tests.
These methods also have an impact on the number of samples. It is a countermeasure against the influence of the distribution of data, but it is not a countermeasure against the effect of sample size.
Testing for distribution deviation is one of Hypothesis Testing from 21 century.
It can also be used as a way to find out whether one group is generally higher in the paired data.
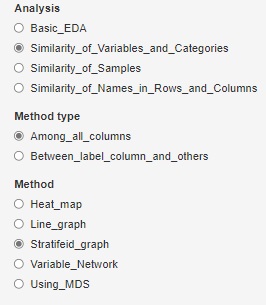
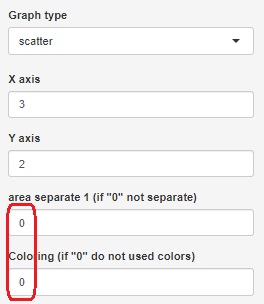
In R-EDA1 , select "scatter" in "Stratifeid_graph" and set the stratification and color coding variables to 0 so that they are not specified. The result is.
NEXT  Testing for distribution deviation
