The "test of distribution deviation" on this page is one of the methods devised by the author as a Hypothesis Testing from 21 century. As with other 21st century tests, it is possible that the same thing has already been announced in the world. It doesn't seem to be as far as the author knows, so I named it.
The Distribution Misalignment Test is the 21st century test version of the mean test.
Since the Paired t-test is an application of the mean test, the "distribution deviation test" can be applied as a 21st century test version of the paired test. On this page, we will start with the corresponding tests, and then we will explain the distribution deviation tests in the middle.
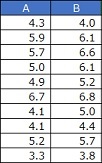
This is a review of the Paired t-test. A paired test is a type of Hypothesis Testing for Diffrence of Average, which examines whether there is a difference in the mean values of two groups, A and B, when there is data like the one below. Suppose that each row of data then has a correspondence. For example, "each row is the same person's data."
Hypothesis Testing for Diffrence of Average
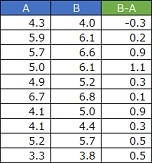
After this, we will test the mean. If B is greater than A, then B-A should be greater than 0, so It is treated as a question of "Can the average value of B-A be said to be greater than 0?"
The "Distribution Deviation Test" is a method used instead of the mean test.
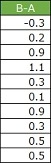
Let's say you have 10 pieces of data as shown in the figure above and you want to find out "Can we say that it is greater than 0?" The mean is 0.45 and the standard deviation is 0.42.
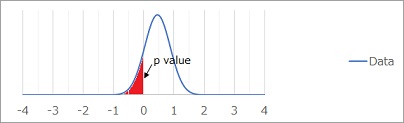
Test 1 for distribution deviation calculates the area of the red part and considers it to be the p-value. A normal distribution is assumed here.
In the case of EXCEL, the p-value is obtained by the formula below.
=NORM. DIST(-0.45,0,0.42,TRUE)
The numbers 0.45 and 0.42 come from the mean and standard deviation. The figure above is a question of "how much the mean value deviates from 0?", but the calculation formula corrects the center of the distribution to 0, so it is "-0.45".
In the test for the difference in the mean value, the number "difference / standard deviation of the mean value" is called the "effect value" and is used as a guide to how much difference there is.
Even in the test of distribution deviation1, the idea of effect size is useful. Here Calculate the mean/standard deviation. For example, it is 1.1 (= 0.45 / 0.42).
If the effect size is large, the variation in the difference is considered to be very small.
The distribution misalignment test2 is simple and examines the proportion of data below 0. In this example, it is 1 out of 10,
so it is
0.1 (= 1/10).
Test 2 for distribution deviation considers that
p-value = 0.1 (= 1/10).
In the above example, the p-value is 0.14 for the distribution misalignment test 1, and the p-value is 0.1 for the distribution misalignment test 2, which is roughly the same value.
Method 1 can be used to see if there is a difference, including what the distribution is. Method 2 is to check if there is a difference in the groups anyway, and it does not take into account how much difference there is. I can't even use the idea of effect size.
Method 1 requires calculations assuming a distribution, while method 2 can be used for anything. It can be said to be a type of nonparametric test.
There are two caveats to the Paired Tests page, but both 1 and 2 of the Distribution Misalignment tests are methods that are not affected by the number of samples. Method 1 is affected by outliers, while method 2 is not.
On the Paired Tests page, there is an example where a test for the difference between paired means shows B is high, but B is not high overall. This is the case shown in the figure below.
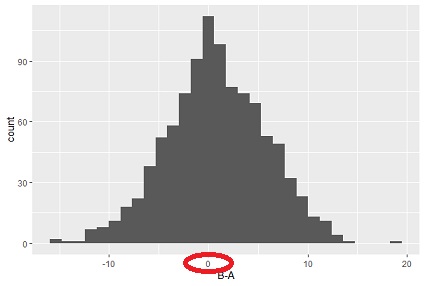
In this example, using the methods on this page:
Test of Distribution Deviation 1 P-value = 0.47
Effect size of Test 1 of Distribution Deviation = 0.086
Test of Distribution Deviation 2 P-value = 0.43
On the Paired Tests page, it is explained that "B is not high overall" just by the appearance of the graph, but quantitatively it looks like this.
If there is only a corresponding test, "B is significantly higher! It tends to be, If we also analyze these, we will be able to quantitatively show that "A is lower in 40% or more".
When using this analysis as a theme, I think it is better to draw the final conclusion based on the average value of B-A and the range of B-A.
NEXT  Hypothesis Testing for Diffrence of Dispersion
