In my case, in my business, the Hypothesis Testing was required before the Estimation. Therefore, the order of this site is also the test first.
On the other hand, it seems that it is better to think of the content of the theory as "estimation comes first".
As an explanation of the transition from estimation to test, we will take the introductory "test of the mean" as an example. Within the scope of the author's experience, there are no situations where "average value test" is used directly in practice. However, the "test of the mean" is Since it is the theory that is the basis of the "test of the difference in mean values", it is an unavoidable theory in that sense. In addition, the paired test is an application of the mean test. In practice, there are situations where corresponding tests are used, so in that sense it is unavoidable.
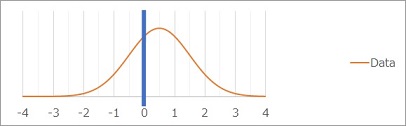
The mean test is, for example, "If the data are orange, can I reject (refute) the hypothesis that the true mean may be 0?" In other words, "the orange distribution is about 1 when the average value is calculated. In fact, the true average value is 0, and if we take more data, won't the average value approach 0?" It is a question that answers the question.
Here, we will use the idea of confidence intervals and standard errors in the theory of estimation.
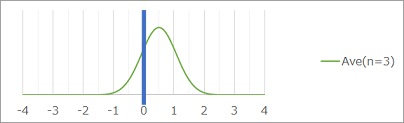
If the distribution of the above data is written using n=3, that is, 3 data, the distribution of the mean values is estimated as shown in the green distribution below. In this graph, the distribution range contains 0. Therefore, there is still a possibility that the true mean value is 0, and as the data increases, the mean value may become 0. In other words, it cannot be rejected.
In this way, the theory of estimation is applied to the test. The "distribution of mean values" is something that we are not familiar with in everyday sense, but we apply it.
Note that in the actual situation of the mean test, it is judged by whether or not it enters the confidence interval, not the graph as in the example above.
Even if the mean and standard deviation are the same data, different sample sizes have different ranges of distribution of means.
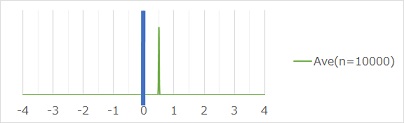
If the orange distribution uses 10000 data, the distribution of the mean values is as follows. In this graph, 0 is outside the range of the distribution of the mean value, so the question "The true mean may be 0" can be answered with "I can't think of that."
The mean test is a theory that looks only at the mean. It doesn't matter what the distribution of the original data is, only what the true mean is.
It is not a mistake in itself to apply the estimation of the mean to the test of the mean. "The effect of the number of samples" and "look only at the average value" are not wrong as a method of examining the average value.
However, the problem is that what you actually want to do in practice does not match the method of testing the average value. Although it is out of the scope of this page, Testing for distribution deviation is a method that matches what you want to do and how it is.
NEXT  Prediction intervals
