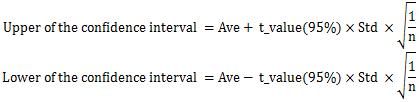
The confidence interval, for example, is the range of three samples of data and the mean and standard error used to find the range above. Considering the small number of samples, we often assume a t-distribution. Here, as an example, I wrote 95%.
Both confidence intervals and credible intervals are intervals for statistics. Confidence intervals appear in general statistics, that is, explanations based on frequentism. The credible interval, appears in a commentary based on Bayesian theory.
For example, the mean has both confidence intervals and confidence intervals. Confidence intervals and confidence intervals exist for various statistics, but this page describes them for the mean. On the page with error and n numbers, there is a confidence interval for the variance.
In my case, I first started using confidence intervals as a way to summarize the data measured in my experiments. I was taught in a physics experiment at university. You can use confidence intervals to indicate with what precision you want.
If you use confidence intervals in this way, there is no particular problem, but if you try to apply them to things like "What is the probability that the interval contains a true value?" Interpretation has become important, and there are various debates in the world.
The confidence interval, for example, is the range of three samples of data and the mean and standard error used to find the range above. Considering the small number of samples, we often assume a t-distribution. Here, as an example, I wrote 95%.
In the calculation of the confidence interval, there is a part of the standard deviation divided by the square root of the number of samples, which is the same as the Standard Error.
On the Standard Error page, there is a story that as the number of samples increases, the range of the distribution of the mean narrows and converges to a single value. The confidence interval is an easy-to-understand measure of how the distribution of these means spreads.
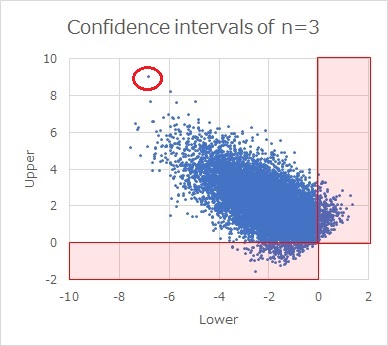
The scatterplot above shows the result of sampling n = 0 data 1 times to obtain 3 confidence intervals from data with a true mean of 10000 and a true standard deviation of 10000.
If you write it as an interval, it will be a mess, so here it is represented as a scatter plot with the upper side of the confidence interval on the vertical axis and the lower side as the horizontal axis. For example, a red dot in the upper left indicates that the upper part of the confidence interval is about 9 and the bottom side is about -7.
Because the true mean is 0, most points are greater than 0 on the upper side of the confidence interval and less than 0 on the lower side. However, there are some confidence intervals that are less than 0 on the top or greater than 0 on the bottom.
If you find a 95% confidence interval, 5% (= 100 - 95) will be the exception to this. (I thought, "Is it true?", so I made 100 million pieces of data and calculated it, and the exception was 0.0500054, so it was certainly 5%).
The 95% confidence interval of 95 appears here.
Standard error is the standard deviation of the mean.
If you know the true mean and the true standard deviation, and you put that number into the confidence interval equation above, the range of confidence intervals includes a mean of 95%. For example, if there is an average of 1,95 doses, <>% of them will be in the range of confidence intervals.
By the way, the above is a "what if" story, and in actual data analysis, the true mean and the true standard deviation are not known, so such a confidence interval is not obtained.
For example, if you create a mean and standard deviation with three data and find a confidence interval, you do not know what percentage of the mean value of the other three data is in the confidence interval.
The meaning of 95% of confidence intervals is something that needs a long explanation. After all, I think that it is good to think that "the confidence interval contains the true mean 95% of the time", but in the world, this is not necessarily the case.
Regarding the understanding that "the confidence interval contains the true mean value 95% of the time", it seems normal to point out that it is "wrong" on the Internet.
When it is pointed out as "wrong", the reason is "In frequentism, the true mean is constant, so it does not have a distribution. Therefore, it is a mistake to assume a distribution and discuss the probability of a true mean." It seems that it is often said. If the name "95% confidence interval" suggests a distribution of true means, I think that is a misunderstanding.
However, "the confidence interval in front of you is like one in a million. If you do it a million times, 95% of it contains the true average. Therefore, there is a 95% probability that one confidence interval in front of you contains a true mean." If you have that in mind, I think it is correct to say that "the probability that the confidence interval contains the true mean is 95%".
"In frequentism, the true mean is a constant, so it is not like it has a distribution. Therefore, it is a mistake to assume a distribution and discuss the probability of a true mean." That's right, but if there is no "true", even if it is a frequent, There is a distribution in the average value.
Even if it is a frequential theory, if you make 100 sets of 3 datasets and calculate 100 average values, there is a distribution of such average values. There is no such thing as 0 or 1, there is 95%.
Whether or not "true" is attached is a very different story.
Credible interval has a similar name and content to a confidence interval, but is calculated differently.
The Credible interval is obtained by assuming the distribution of the true mean as a prior distribution and correcting it with the data. The idea of prior and posterior distributions uses Bayesian Statistics.
The biggest difference from confidence intervals is that it assumes that the true mean has a distribution.
What we are looking for is the distribution of true mean values, so if we extract a 95% interval from it, for example, there is a 95% probability that the interval will contain the true mean. The explanation of "an interval that contains the true mean value 95% of the time" is the same, What we assume as a probability is completely different from when we say that the confidence interval contains the true mean 95% of the time.
I explained that "the credible interval is an interval that contains the true mean 95% of the time", but this is easy to misunderstand.
Confidence intervals are made from assuming that the distribution of true means is like this, and correcting that assumption with data. So, if the initial assumption is wrong, the corrected one is also wrong. If there are outliers in the data, it also affects the confidence intervals obtained.
It is not wrong to explain that "the credible interval is an interval that contains the true mean value 95% of the time", but it is a story that is made up of assumptions. If you extract only "the credible interval is an interval that contains the true mean with a probability of 95%", then unlike the confidence interval, It seems like a theory that directly tells us the true average value, but it is not.
Confidence intervals and credible intervals are neither superior. The following is likely to be a reference for proper use.
When analyzing experimental data that has repeatedly measured the same object, it is better to wait for all of the following four points to find the confidence interval.
There are two types of average values in the world.
One is the mean value, which has a meaning inherent in the true value. For example, a measurement of a person's weight. There should always be a true value, but due to the variability of measurements, multiple measurements will not necessarily result in the same value. Therefore, the true value is estimated by the average value measured multiple times.
The other is the mean value, which has no meaning inherent in the true value. The average value as a representative value when expressing a group is such an average value. This is, for example, the average value of the weight of all citizens, even at the same weight. For example, sample 100 people and weigh them. There should be a true value, but the implications are different because it is not an individual, but its weight. Individuals have inherent true values.
It is explained that "Bayesian theory considers data as fixed values and statistics as variables", but since it is the weight of the individual that has the unique value, For the mean value as a representative value, I think the Bayesian approach that assumes the distribution of the mean value is good.
On the other hand, frequentism explains that "data are considered variables and statistics are eigenvalues." If we assume that the true value has its own meaning and that the data are found to be different from the true value for measurement reasons, then it is in line with the idea of frequentism. The frequentist approach seems to be good.
The Bayesian approach assumes the shape of the distribution.
In experimental data, the number of samples may be several pieces, but with several data, it is not possible to assume a distribution. You can only assume a distribution if you have prior knowledge.
As mentioned above, confidence intervals have the characteristic of standard errors.
The confidence interval is a measure of how certain it is that the calculated mean is the current number of samples.
The calculation of the credible interval includes the part that is designed by the person who calculates it.
The confidence interval is obtained with no room for people except for what percentage should be used. In terms of value transparency, confidence intervals are more convenient.
If you use Excel's function, if there is data between cells A3 and A7, you can find it as
Upper of Confidence intervals =AVERAGE(A3:A7)+TINV(1-0.95,COUNT(A3:A7)-1)*STDEV(A3:A7)*SQRT(1/COUNT(A3:A7))
ggplot2 and seaborn have the ability to display confidence intervals for complex distributions.
Strength and Weakness of Big Data
NEXT  From Estimation to Hypothesis Testing
