Standard Error
Unlike Standard Deviation, standard error is less well known.
In any case, the calculation formula is not so difficult, but even if you look at the calculation formula, it is difficult to understand what it is. On this page, we start with the variation of the average value.
Variation in mean values
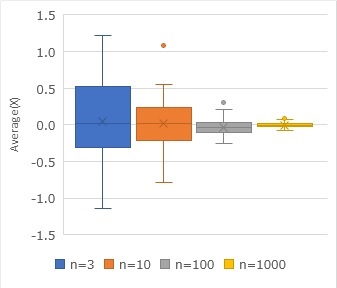
The graph above shows the average value calculated for a randomly sampled sample from a normal distribution with a mean of 0 and a standard deviation of 1. n=3 means that the number of samples is 3. This graph is made by sampling 100 times for each sample number and calculating the average value each time.
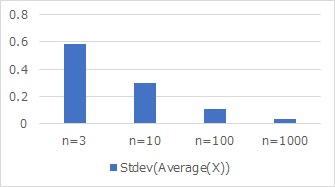
It can be seen that the average value calculated by random sampling varies considerably from the true mean, and that the variation is smaller as the number of samples increases. If you calculate this variation as standard deviation, you will see the graph below. This graph is called the "standard deviation of the mean," which is a graph that you don't usually see.
Standard Error
Suddenly, if you calculate the true standard deviation of 1 divided by the square root of the number of samples (Sqrt(n)) and arrange them in the graph above, you get the graph below.
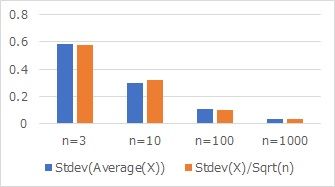
The standard deviation of the mean, the true standard deviation, and the number of samples. You can see from the graph that almost the same values are calculated.
Using the true standard deviation and the number of samples, the standard deviation of the mean can be obtained analytically.
The standard deviation of the mean is called the standard error and describes how the mean varies.
Variation in standard error
In actual data analysis, it is common to not know what the "true standard deviation" is. The standard deviation is derived from the sample.
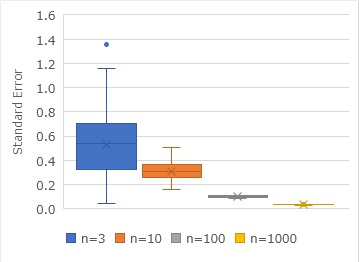
Similar to the graph of the variation of the mean value, if you examine the variation of the standard error, you will see the graph below. The standard deviation is calculated and then divided by the square root of the number of samples.
Implications as a measurement of standard error
The standard error represents the precision of the value.
For example, suppose there are times when the average value is 0.0 and 0.5. If the sample number is 3, even if the true mean value is 0.0, it is quite possible from the standard error that the number 0.5 will be obtained. "0.0 and 0.5, each group does not know whether the population is the same or different."
If the number of samples is 1000, if the true mean is 0.0, it is unlikely that the number will be 0.5. "It is very likely that each group will have a different population, which will be 0.0 and 0.5."
You can't just look at the numbers 0.0 and 0.5 to get an idea of what these populations are, but you can use standard errors to make a decision.
By the way, the theory that considers whether there is a difference in the average value with this way of thinking is the Hypothesis Testing for Diffrence of Average.
Standard error and true standard deviation are different
The above example is a distribution with a true standard deviation of 1. The standard error approaches 0 the more samples there are. On the other hand, the true standard deviation is the same, regardless of the number of samples.
Outside the scope of this page, traditional test methods use standard errors to determine that there is a difference in the mean value. When making this determination, we do not take into account what the true standard deviation is. On the other hand, the "let's also consider the true standard deviation" approach is Hypothesis Testing from 21 century.
NEXT  Unbiased Variance
