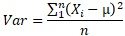
When calculating the standard deviation and variance, the question is, "Is the denominator n or n-1?"
In textbooks, first of all, the formula divided by n appears as the formula for dispersion.
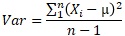
After that, the equation divided by n-1 comes out as the unbiased variance formula, and it is said that "basically use this". When contrasting with unbiased variance, the one divided by n is called "sample variance".
After that, the equation divided by n-1 comes out as the unbiased variance formula, and it is said that "basically use this". When contrasting with unbiased variance, the one divided by n is called "sample variance".
In the case of an average value, the average value calculated from the definition formula and the expected value of the average value (average value of the average value) are the same value. The average value of the average value is, for example, the average value of 10 sets of average values obtained from 5 samples, and it is the average value of the 10 average values.
In the case of the average value, the average value obtained from the actual five samples and the average value calculated by collecting such average values are slightly different. The reason for the deviation is that the average value of only 5 samples is a coarser calculation.
In the case of variance, the value calculated from the definition formula (the formula divided by n) and the expected value (the average value of the variance) are different. The point is that the variance of only 5 samples is not only due to coarser calculations. The operation of calculating the average value also causes the deviation.
In the case of variance, when trying to find the expected value (mean) of the variance, the calculation does not fit unless the variance of the sample mean is subtracted from the value obtained as the sample variance.
The expected value of this variance is unbiased variance. If your goal is to find the expected variance, you are looking for unbiased variance.
In the general explanation of statistics, the case where sample variance is used is when the data to be calculated is total. In other words, if you have data for all members and you want to calculate the variance, use the sample variance. If you want to estimate the variance of all members from the data of some members, use unbiased variance.
In my case, I sometimes use sample variance for different reasons.
When grasping the contents of data practically, "sum of squares divided by n" and "average squared value" are helpful as well as average values (sum divided by n). What is needed at this time is not "the expected value of the sum of squares divided by n". This is because we do not want to know the "expected value". In such cases, the formula for calculating the sample variance is more useful. Sample dispersion is also more convenient because simple tools are more convenient to use.
The difference between n and n-1 is the difference in denominator.
For example, if n is 5, for the same molecule, the sample variance is divided by 5 and the unbiased variance is divided by 4. This means that the sample variance is 4/5 times smaller.
In general, "the unbiased variance is close to the estimated value, and the sample variance is 4/5 times different, so in that sense we cannot use the sample variance." This is the explanation.
It's an easy point to misunderstand, It is not "When it becomes n-1, the true value is obtained, so it is n-1". It's just because it is close to the estimate of the true value.
To conclude first, in practice, the difference between n and n-1 does not cause any inconvenience. (Although it is within the scope of the author's experience)
You can see that when the number of samples is large, the difference between n and n-1 almost disappears, just by looking at the equation. Therefore, if you have a large number of samples, you don't have to worry about the difference between n and n-1.
When the number of samples is small, the textbook explanation is that "the difference between n and n-1 is large", but from a practical point of view, Even if the number of samples is small, the effect of the difference between n and n-1 is so small that it is not known. The reason for this is explained below.
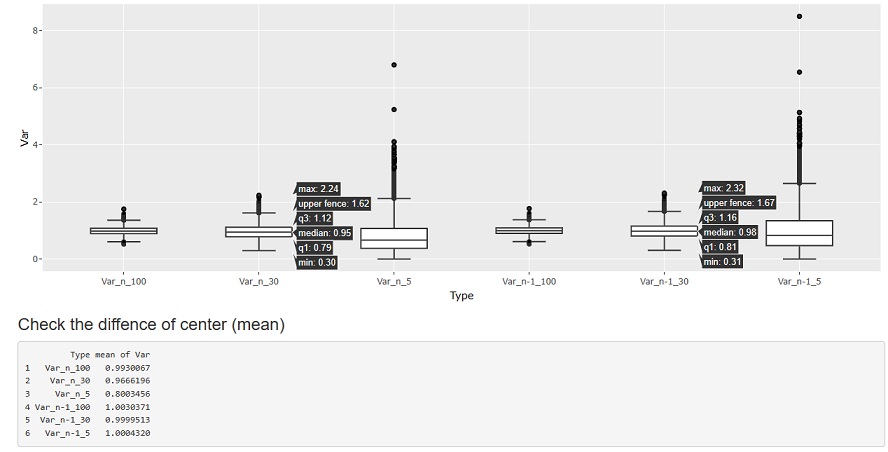
The figure below shows a random sampling from the Standard Normal Distribution to create 10000 groups with 5 samples, and calculate the variance for each group. Variance is generally used as an indicator of distribution variability. Here, we are investigating the "distribution of variance", which is not usually done with data analysis.
Var_n_5 is the sample variance with a sample size of 5 and the denominator of n, and Var_n-1_5 is the unbiased variance with a sample size of 5 and a denominator of n-1.
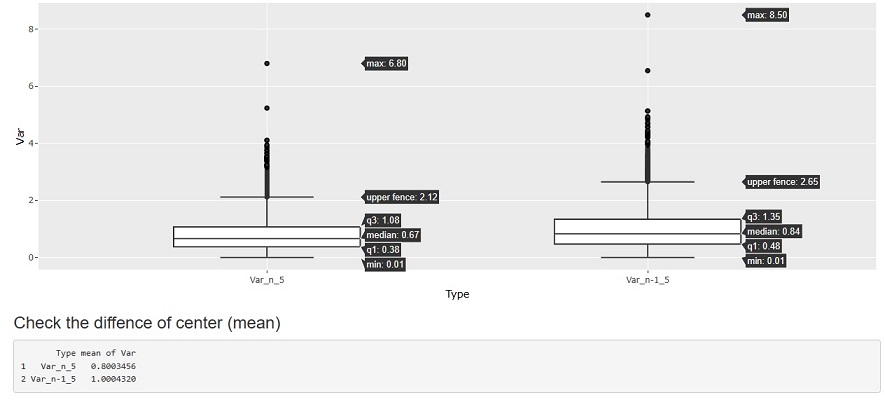
If you look at the mean value below before the graph, you can see that n is 1/4 times (5.0/8.1) of n-0, so the story that "4/5 times different" is true. Since it is a standard normal distribution, the true value is exactly 1. It can be seen that the mean value of the unbiased variance calculated by n-1 is very close to the true value.ÅB
The first point to note is the amount of variation. Regardless of whether n or n-1, there is a difference of about 7~8 between the maximum and minimum values.
Since there is such a variation, a difference in the average value of about 0.2 is not a big difference. Even if you make a mistake in calculating the unbiased variance and the sample variance, the difference is such that you cannot tell whether it is a range of variation or a mistake just by looking at the value of one variance.
Regardless of whether n or n-1, it is impossible to use the variance or standard deviation calculated with a sample size of about 5 as a reference value when discussing that "variability has changed" or when managing subtle values.
However, it is not completely useless, and in this example, it is an indicator when judging that it is "clearly off" for a sample whose value is greater than 10. In practice, extreme outliers can occur, so you can use it to filter them.
he next point to note is the median. In this case, the median is the most likely to appear.
If you look at this, it is 0.67 for n and 1.0 for n-84. n-1 is closer to the true value, but it is not accurate enough to be used as a true value. It can also be said that "even if n-1 is used, the value is often lower than the true value".
The story that n-1 is close to the true value is the story of the average value of the variance. In practice, we usually only calculate one variance, not the average value of the variance. If you calculate the average of the variances, it is certainly clear that it is not n-1, but if you do not calculate this and proceed with something with only one variance, There is no difference between n-1 and n.
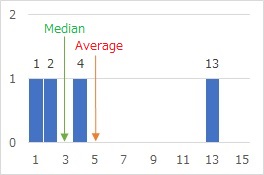
The median is deviated from the average value in the figure below as a simple example. When there are samples 1, 2, 4, and 13, the mean is 5 and the median is 3. The median is in the middle of the order, but the average value is larger on the left.
Unbiased variance is said to be an estimate of the true value, but a value that seems to be an estimate of the true value appears when the average value is calculated by obtaining several unbiased variances. The individual unbiased variances are often calculated to be lower than the true value. I think it is safe to say that this is "biased", but I have not seen any material that explains that it is "biased" for unbiased dispersion.
I examined the same cases where the sample size was 30 and cases where there were 100 samples.
In general, there is talk that "any distribution can be considered a normal distribution if the number of samples is about 30", but the standard for discussing variance is also about 30. If there are about 30, the difference between n and n-1 will hardly appear. Also, not only the average, but also the median is much closer to the true value.
I wrote something similar on the page Errors and Sample Number and the Relationship between dispersion ratio, p-value, and number of samples, but if you want to argue that "the variance has increased (decreased)", in my experience, it is better to have about 100 samples. Otherwise, every time you investigate, you will say "there was an improvement effect" or "there was no improvement effect", and the conclusion will change.
If there are about 100 samples, there is almost no difference between n and n-1, so there is no particular inconvenience in using either one.
NEXT  Hypothesis Testing
