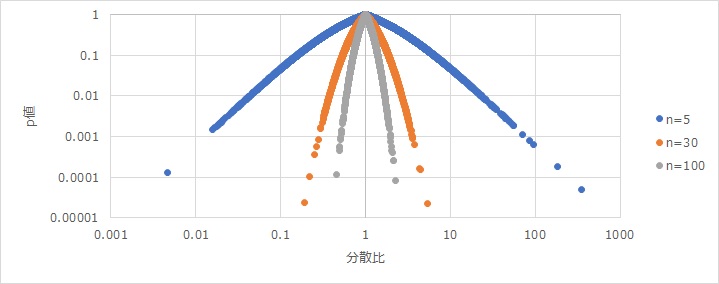
This is a beautiful curve. The horizontal axis is the variance ratio, the vertical axis is the p-value of the F-test, and there are three types of samples. "n=5" indicates that each of the two groups has 5 samples.
The most popular Hypothesis Testing for Diffrence of Dispersion is the F-test.
When you want to find out "Is there a difference between the two average values?", Compare the difference (subtraction value) as shown in Test for the difference in the mean value. When you want to find out whether there is a difference between the two variances, look up the ratio (divided value). For example, if the variance of group 1 is 1 and the variance of group 2 is 3, the ratio is 3.
The content of this page is something that I happened to notice while researching something else. I tried to do something else and made a scatter plot, and I got a beautiful curve, so I was like, "What's that?" Have become.
If you look it up, it may be written in some literature, but I have never seen it. If you know, I would appreciate it if you could tell me.
This is a beautiful curve. The horizontal axis is the variance ratio, the vertical axis is the p-value of the F-test, and there are three types of samples. "n=5" indicates that each of the two groups has 5 samples.
As for how to look at the curve, first of all, there is a vertex in the middle where the dispersion ratio is 1, and the value of the vertical axis is 1. This indicates that a variance ratio of 1 is the most likely to occur.
If the horizontal axis of n = 5 is around 100, the p-value is 0.001. Considering that the general p-value is 0.05, When n = 5, it means that if the dispersion ratio is 10 times or more, the variance of the two groups is considered to be different. For example, "5 times the variance" sounds like a huge difference, but it also means that it is difficult to think that the dispersion of the two groups is different.
When testing the difference in mean values, the p-value is determined by three factors: the difference in the size of the mean, the size of the variability in the data, and the number of samples (n numbers).
This curve shows that in the test of the ratio of variances, the p-value is determined by only two factors: the difference in the size of the variance and the number of samples. It is common for the p-value to change depending on the number of samples. When you want to evaluate the difference in average values, you cannot judge only by the size of the difference in average values, so you consider variability. When you want to evaluate differences in variance, no factors other than the variance value are used.
If n=5, Make two sets of 5 normally distributed samples. This data is obtained by the EXCEL function "=norminv(rand(),0,1)". For each cell, a randomly sampled value is calculated from a normal distribution with a mean of 0 and a standard deviation of 1.
For each set, calculate the variance and then divide to get the variance ratio. This value is the horizontal axis.
We also test the ratio of the variances of the two sets to find the p-value. This value is the vertical axis.
Create 10000,10000 ways of this data. That is, find the variance ratio of <> pieces and the p-value.
The dispersion ratio varies considerably, but if you make 10000 dispersion ratios by the above method, the variation is as follows: I tried it myself and learned about it for the first time.
Make the same for n=30 and n=100. All that's left is to graph it.
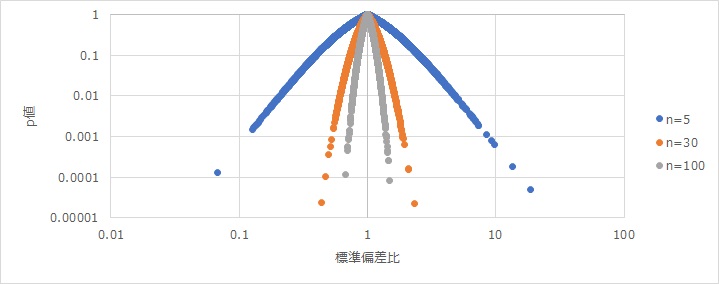
Since variance is a unit that is not used in reality, standard deviation is often used as a measure of variability in practical data analysis.
As a guideline at that time, the figure below shows the relationship between the standard deviation ratio, p-value, and number of samples in the same way as the figure above.
This page is for p-values only. Variability in variance and standard deviation is explained in Errors and Sample Number in terms of confidence intervals. In terms of the distribution of specific statistics, see Unbiased Variance.
NEXT  Test for differences in normal distribution variability
