As shown on the Relationship between dispersion ratio, p-value, and number of samples page, the test of the ratio of variances gives a result that there is a difference in variation. When the variation is extremely different, or when the number of samples is very large.
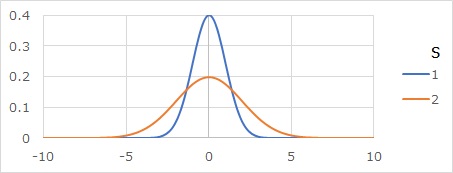
For example, if the ratio of standard deviations is twice as high as the graph below, the variation clearly looks different, but even with this level difference, In the test of the ratio of variances, For example, you can't judge if n is not about 100.
Also, in modern times, it is easy to investigate even if the sample size is about 1000 or 10000, but at this scale, it is difficult to use the method of "always being significant".
It is a well-established theory that "the difference in variation is examined by testing the ratio of variance", and this page is a proposal for improving that established theory.
Above, I wrote two problems when using the test of the ratio of variances. First, if the number of samples is not large to a certain extent, it is not possible to judge the difference in variability that appears in practice, because of the nature of the measure of variance itself, as described on the Unbiased Variance page.
The second property, that the p-value tends to be small when the number of samples is large, and that it is always significant, is that the reason why something similar happens in the Hypothesis Testing for Diffrence of Average is the same, and the purpose and means are not matched.
The test of the ratio of variance is purely a means of looking at the presence or absence of differences in variance numbers, but in general, when you want to investigate the difference in variation, it is not a difference in numbers, but a difference in spreading, so this point is not correct.
The test for differences in the variation of the normal distribution is a method devised by the author as a method to investigate differences in the spread of distributions. (If you already have the same idea in the world, if you know of it, I would appreciate it if you could tell me.)
The idea is similar to Test for Normal Distribution Differences. The Test for Normal Distribution Differences has been devised as an alternative to the Hypothesis Testing for Diffrence of Average. The test for differences in the variation of the normal distribution is It is devised as an alternative to the test of the ratio of distributions.
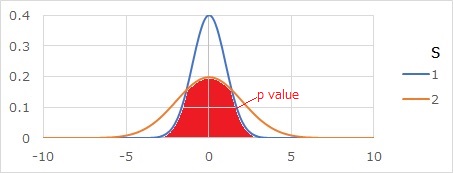
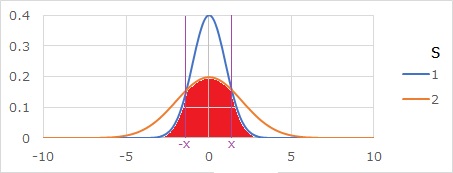
The p-value for the test for differences in normal distribution variability is the red part of the graph below. It will be the area where the two distributions overlap.
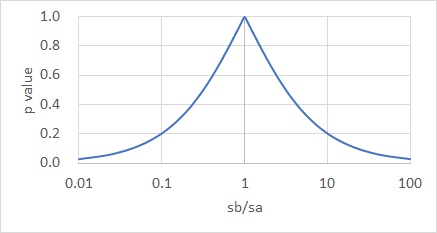
If you do the math, you will get the graph below. The horizontal axis of the graph is the ratio of the standard deviations of the two distributions. The different the two standard deviations, the smaller the value.
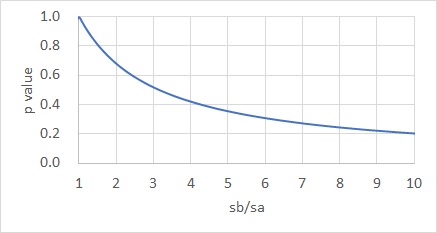
If you zoom in on the part that you see closely, you will see the graph below.
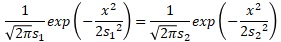
It is the area where the two distributions overlap, but first find the intersection x of the curves of the probability density function.
Substituting into the formula for the probability density function, we get:
Sorting this out yields the expression of x.
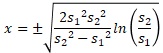
If two standard deviations are entered in cells A2 and B2, the function to find this x in EXCEL is as follows:
=-SQRT(2*B2^2*A2^2/(B2^2-A2^2)*LN(B2/A2))
If the above function to find x is written in cell D2, the function to find the p value in EXCEL is as follows.
=2*(0.5-NORMDIST(D2,0,MAX(A2:B2),TRUE)+NORMDIST(D2,0,MIN(A2:B2),TRUE))
Here, the first part "2*" represents doubling the formula for finding only the area of the left half. "0.5" means that the area of the left half of the normal distribution is 0.5. MAX and MIN are used because if the relationship between the magnitude of the two standard deviations is wrong, the p-value cannot be obtained by this equation. With this function, if the standard deviation is exactly the same, an error occurs.
NEXT  Assessing differences in variation for small data
