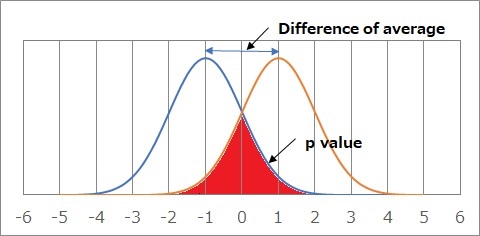
The figure above shows two normal distributions with a standard deviation of 0 and a mean deviation of 2. In the test for differences in distribution, the area of the reddened part is considered to be the p-value.
It is within the scope of the author's experience, but in the actual situation usindg Hypothesis Testing for Diffrence of Average, the purpose is not to know the difference in the average value, but what I actually want to know is "Can I say that the distribution is off?" What I want to know is the deviation, but in order to know it, I am looking at the difference in the average value for convenience.
If it doesn't match your purpose, you don't have to stick to testing the difference in average values, but I can't think of anything else, so if you use this, As the number of samples increases, the p-value approaches 0 as much as possible, which is a struggle with the unique nature of this method.
What may be useful in such a case is what I named "Test for Normal Distribution Differences" on this page. (If there is a way in the world to use the same content but a different name, I will match it, but it seems to be impossible, so for the time being, I will use this name.)
The normal distribution difference test is the same as the statistical test method in that it is calculated by approximating the actual data with a statistical distribution and the p-value (probability ) is calculated.
In addition, the point of judging by the percentage of correctness of discrimination is the same as the method of label classification such as discriminant analysis.
The test for differences in a normal distribution is an image of judging true or false with data approximated by the distribution equation, rather than judging true or false with actual data.
In the test of the difference of the normal distribution, when approximating the distribution, it is necessary to consider "Is this distribution really good?" Once the distribution is determined, it is not affected by the number of samples.
There is no unnatural phenomenon that the p-value becomes as close to 0 as possible.
In the test for difference in the mean value, an effect size like Cohen's d is a way to make a good judgment without being affected by the number of samples.
In this case, there are difficulties unique to the new scale, such as "How much effect size can be said to make a difference?" The p-value has the convenience and ease of understanding because it can be determined on a scale such as probability or percentage.
In the test of the difference in the normal distribution, the p-value is calculated, so it is possible to perform a test-like analysis, which is an easy-to-understand analysis method for those who are accustomed to testing.
The figure above shows two normal distributions with a standard deviation of 0 and a mean deviation of 2. In the test for differences in distribution, the area of the reddened part is considered to be the p-value.
The relationship between the difference between the mean value and the p-value is shown in the figure below. If there is no difference, it is 1, and the larger the difference, the closer it is to 0, so we can see that it has properties similar to the p-value of the test for difference in the mean.
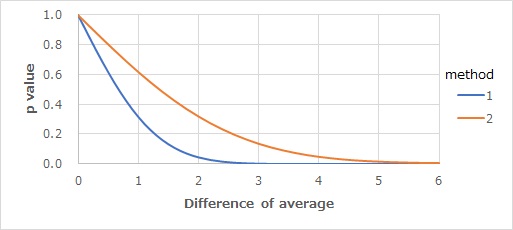
If the difference between the means is 1, that is, exactly the same as the standard deviation, the p-value is slightly higher than 0.6.
In the case of EXCEL, for example, if the difference is 2, the p-value is obtained by the formula below.
=NORM.DIST(-1,0,1,TRUE)*2
The number "-1,0,1" The "1" of -1 is determined from "the difference is half of 2". 0 means a distribution of 0, and the rightmost 1 means a standard deviation of 1.
The graph above is calculated using a normal distribution with a standard deviation of 1, so the horizontal axis is about the same as the effect size like Cohen's d.
In the distribution difference test, instead of calculating the overlapping portion of the two distributions for a histogram made from actual data, The distribution is approximated and calculated by the probability density function created from actual data.
In this way, there is no effect even if the number of samples in the two distributions is very different, and the effect of data roughness that occurs when data is small can be reduced.
NEXT  Rrelationship between the difference in true means and the analysis method
