First, the effect size looks like the graph above. The effect size is calculated without using absolute values.
Testing for Mean Differences uses the data to find out if there is a difference in the means. You can't tell just by looking at the data, but the average value you can see from the data is the value that you think is close to the true value.
Normally, we do not know what the true value is, but we analyze it on the assumption that it exists. Therefore, "If there is a "true" value for the difference in the average value, how close is it to the truth by sampling from it?" Normally I don't know.
So, I investigated it by simulation.
Generate and examine random numbers with a mean of 0 and 1, both with a standard deviation of 1. Therefore, the difference between the average values of 1 is the true value.
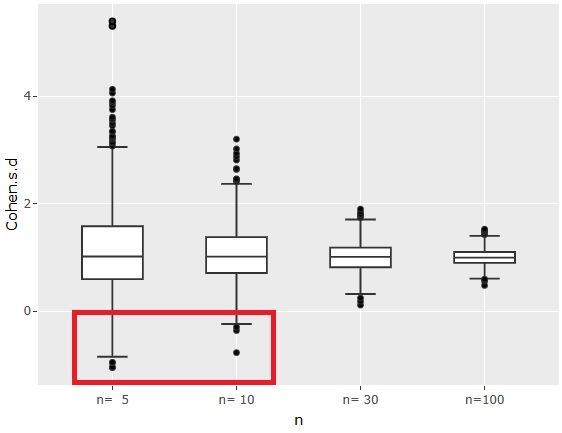
First, the effect size looks like the graph above. The effect size is calculated without using absolute values.
Regardless of the number of samples, the effect size is centered on 1 because the difference in the mean is 1 and the standard deviation is 1.
When the number of samples n is 5 or 10, you can see that the effect size may be negative, that is, the average value may be sampled so that the magnitude is reversed.
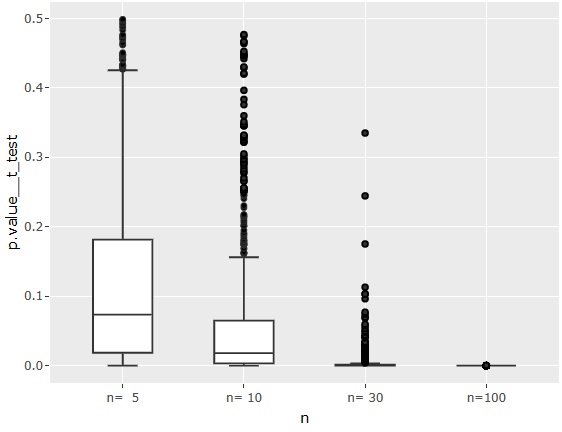
The p-value for the test of common mean differences.
When n = 5, the median is higher than 0.05, so if the difference in true mean values is about 1, it is difficult to judge that there is a difference.
If n = 100, it is definitely judged that there is a difference.
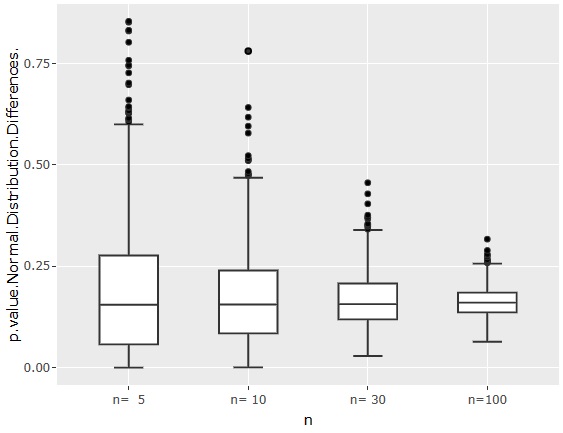
This is the p-value for the first method described on the Test for Normal Distribution Differences page.
Even if n = 100, the p-value is sometimes about 0.25, so if you think about it from the sense that "the p-value is 0.05 as a guide", you can see that it is a very strict method to judge that there is a difference.
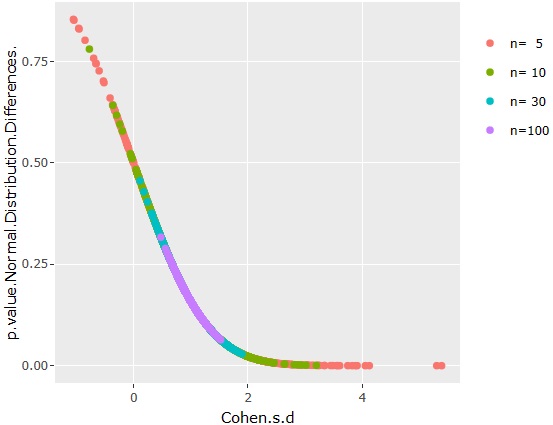
The relationship between the effect size and the normal distribution difference test 1 is shown in the graph above.
Since the effect size and test 1 for normal distribution differences overlap regardless of the number of samples, we can see that these measures are not affected by the number of samples.
Considering the above method on this page, I feel that making a decision based on n = 5 or 10 can be said to be. I feel like I can't judge unless there are at least 100.
On the other hand, in my experience with factory-related data so far, I have never made a judgment based on n = 5, and after the data increased, I never made a "that judgment was a mistake."
In other words, it seems that the premise of statistics that "data is something that can be called a true value or distribution, and is randomly sampled fr
NEXT  Effect size of small data test
