As shown on the Relationship between dispersion ratio, p-value, and number of samples page, the test for the ratio of variances shows that there is a difference in variability when the variation is extremely different or when the number of samples is very large. When the number of samples is very large, it is not as simple as "If the number of samples is very large, you can use the test of the ratio of variance". It is better to use Test for differences in normal distribution variability.
When the number of samples is small, check to see if the variation is extremely different.
Logarithmic analysis is useful both as a way to make it easier to see differences in orders of magnitude and to evaluate ratios.
Since it is only logarithmic, it does not have a sense of luxury, but I think that the reason why it is good to make it logarithmic is that it is knowledge that is good to know.
Using logarithms, For example,
log(10) = 1
log(100) = 2
. If it is one order of magnitude different, the difference will be as much as "1".
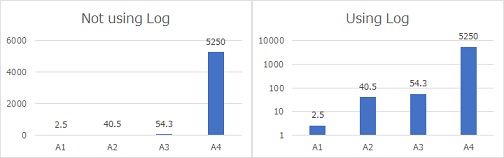
In the figure below, you can see that A4 is extremely high on the left, but you can't see the difference for the others. On the right is logarithmic of the same data, but A2 and A3 are about the same, and A1 is even smaller than them.
Logarithm makes it easier to see the difference in the number of digits when data with different digits is mixed.
For example, for a bar chart: The difference is examined as the difference in the length of the two bars, so you can see it just by looking at the graph. On the other hand, you can't know the ratio unless you divide the lengths into each other in your head. I calculate it in my head like "Is it about a fourfold difference?"
On a different note,
log(B) - log(A) =log(B/A)
.
In other words, the difference between logarithmic numbers is the same as the ratio between numbers before logarithm.
Because of this property, in a logarithmic graph, examining the difference in the lengths of two bars is the same as looking at the ratio of the original data.
With small data, if the variation is not different by orders of magnitude, it is not possible to conclude that there is a difference in variability.
As described in Hypothesis Testing for Diffrence of Dispersion, when examining differences in variability, we look at the ratio, not the difference in variability. Logarithmic evaluation makes it easier to evaluate ratios. This makes it useful for evaluating differences in variability.
Logarithmic graphing variations is a useful way to make it easier to see differences in orders of magnitude and to evaluate ratios.
The above is a story that "logarithms should be used to evaluate differences in variability", but the author has reorganized the methodology of Quality Engineering as a general data analysis method.
Quality engineering has traditionally used logarithms to evaluate differences in variability.
One of the characteristics of quality engineering is that statistics are expressed by mathematical formulas using logarithms (logs).
Quality engineering cites additivity as a reason for using logarithms. This is to enable this calculation by addition when analyzing data with different experimental conditions in combination.
Quality engineering does not use the theory of testing. Professor Taguchi's own way of thinking was that subtle differences that had to be tested were not regarded as differences in quality issues.
(Data such as those handled in the manufacturing industry are not strictly controlled and measured, so subtle differences are not reproducible.) Therefore, I think that it is best to stop worrying about subtle differences and discuss only clear differences with high reproducibility. Professor Taguchi's idea may have come from this place.
The use of logarithms is a good way to use a small number of samples that must differ by orders of magnitude to be considered to be affected by the condition. In addition, it is a good way to evaluate ratios.
Experimental data such as those handled by quality engineering have a small number of samples. In quality engineering, it is important to evaluate variability.
I don't know if Professor Taguchi had any purpose other than additivity in mind, but it is a very good methodology.
NEXT  Hypothesis Testing for Difference of Ratio
