Generalized Linear Mixed Model(GLMM) is the sum of Generalized Linear Model and Linear Mixed Effect Model.
GLM is application of Regression Analysis .
For examle,
in regression analysis,
Y = a1 * x1 + a2 *x2 + b
In GLM,
Y = f( a1 * x1 + a2 *x2 + b )
LME is also application of Regression Analysis .
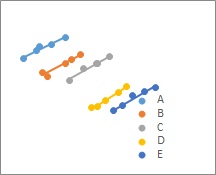
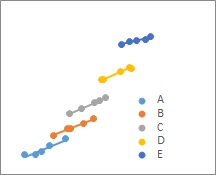
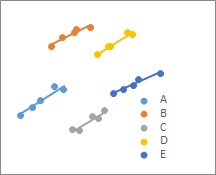
General regression model uses 1 slope and 1 intercept. But LME uses more than 2 of them.
There are 3 examples.
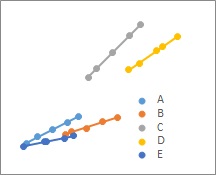
1 Use of LME is not only the case, "More than 2 slopes or intercepts", but also "There are more than 2 data-sets measured repeatedly".
After puttin the categorical variable and giving categorical values for each set, we can use LME.
Quantification Methods uses Dummy Variable .
It is the same way with LME.
GLMM is an application of classical regression analysis. If we need more complicated distribution model, Hierarchical Bayes model is a solution.
Hierarchical Bayes model is an application of Bayesian Statistics .
Example of R is in the page, Generalized linear mixed model by R .
R-EDA1 can use generalized linear model, linear mixed model, and generalized linear mixed model.
Select "Stratifeid_graph" and then "scatter" to use the variables you chose to draw the scatter plot, LMM (Linear Mixed Model), GLMM (Generalized Linear Mix) The result of the model) will appear below the scatter plot.
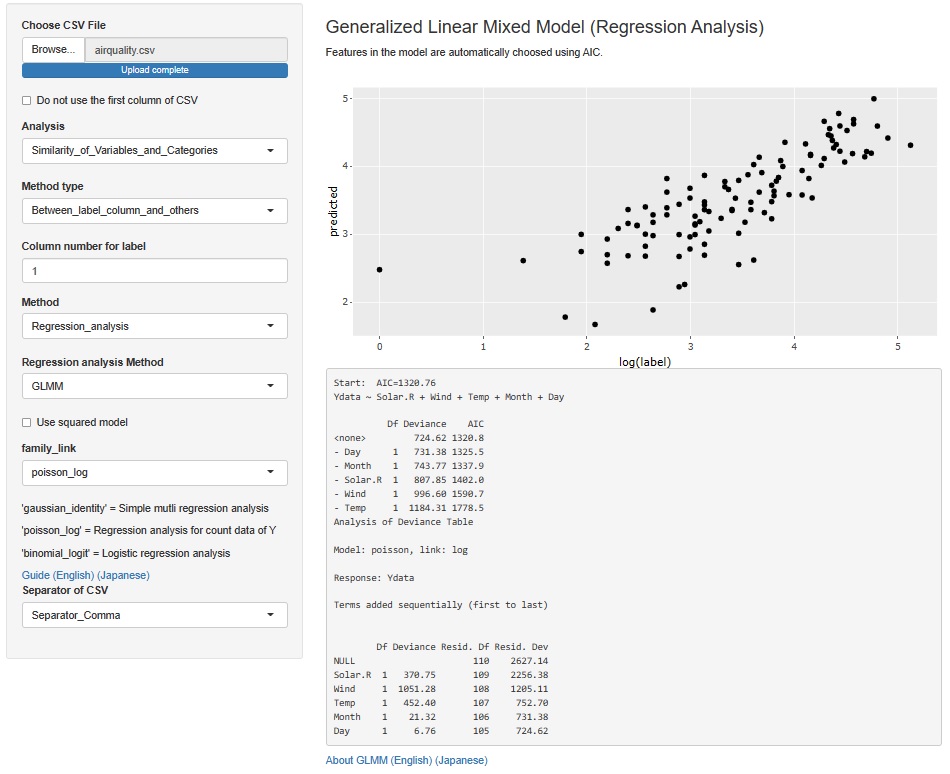
If only the result of GLMM is used, the R-squared (coefficient of determination: square of correlation coefficient) number is not calculated, so LMM is included. Also, in R-EDA1, an error occurs for some reason when writing the above R example, so I am making a model with an interaction term by the method of quantification type I. The step function is used to create a model with non-significant terms removed.
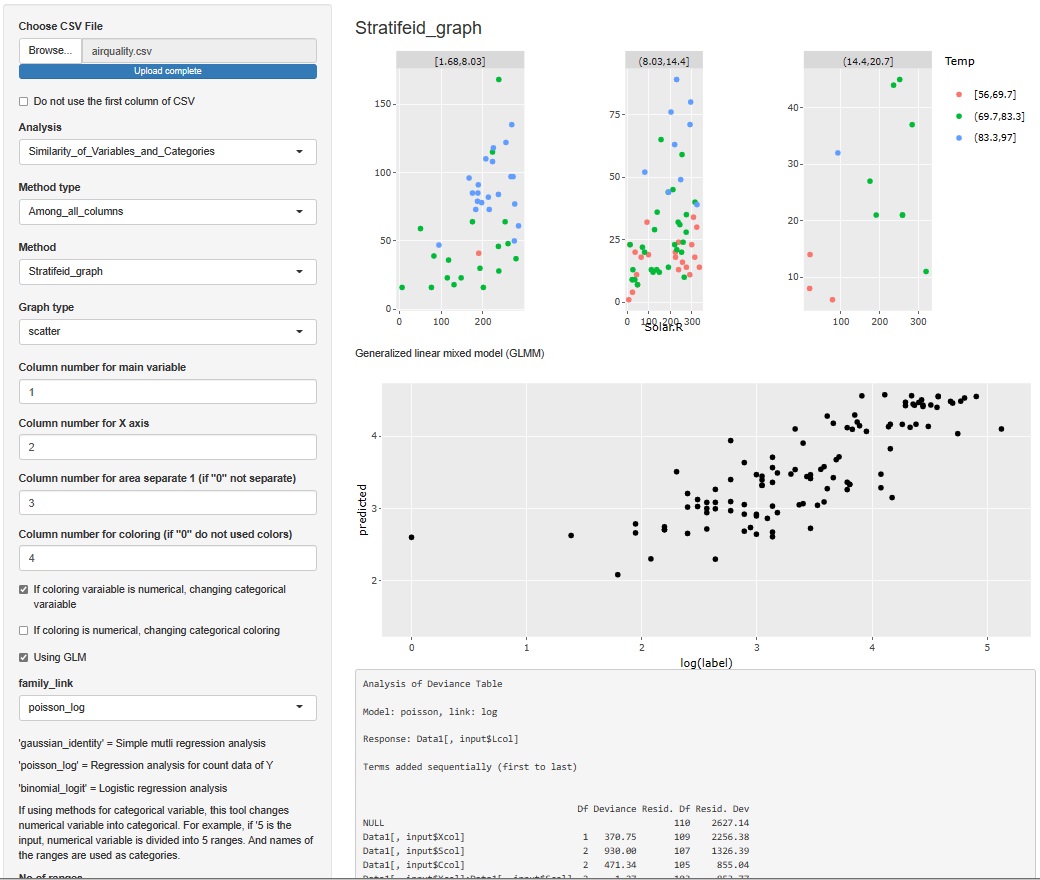
When analyzing a set with a scatter plot, the variables used in the scatter plot are included in the model.
The ability to run GLM on all variables in a dataset is elsewhere.
NEXT  Interval High-dimensional regression analysis
