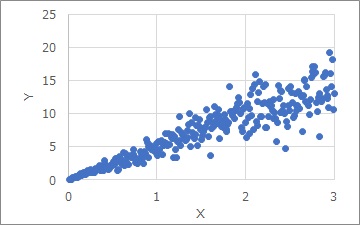
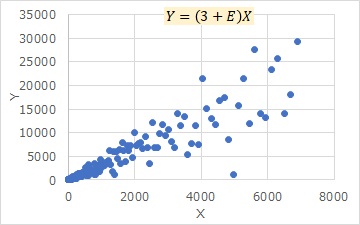
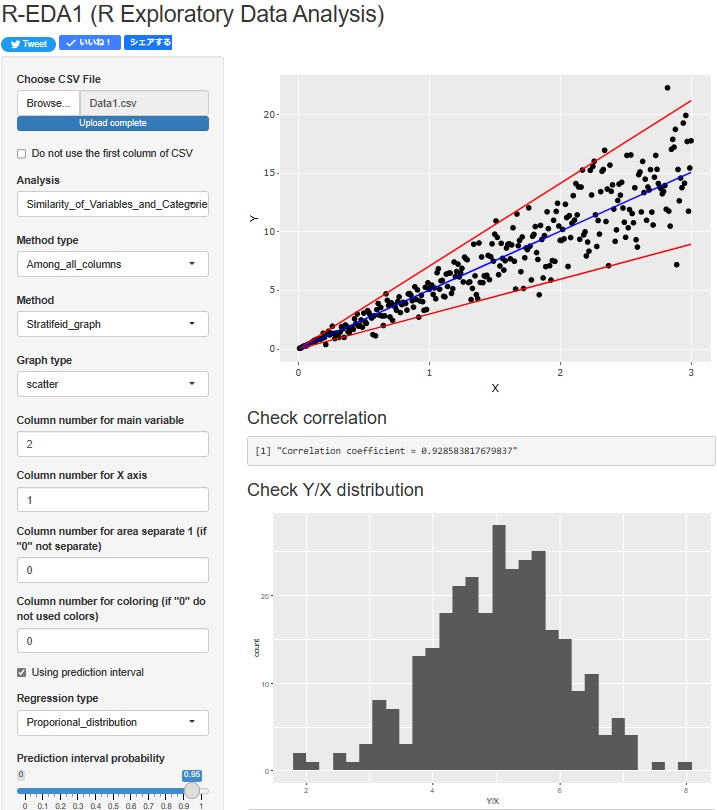
The Proportional variance is a distribution as shown in the graph above. The larger the X, the greater the variation in the Y direction.
The Proportional variance is a distribution as shown in the graph above. The larger the X, the greater the variation in the Y direction.
By the way, the characteristic that "the larger the X, the greater the variation in the Y direction" is also found in the multiplicative model. The difference from the Proportional variance is described on the Additive model and multiplicative model page.
Before regression analysis of Proportional variance, compare it to a typical simple regression analysis.
The equation used by a typical simple regression analysis is as follows:
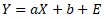
The distribution where this fits perfectly is the distribution shown in the graph below. A is tilted and b is called the Y-intercept. E is variation. In this model, the longitudinal variation is constant. Therefore, the equation assumed by a typical simple regression analysis differs from the Proportional variance.
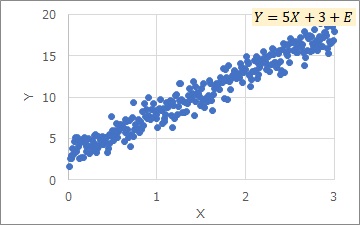

The Proportional variance is expressed by the above equation. A is tilted and E is variation.
The Proportional variance is much easier to understand when it is transformed.
In the graph below, the left side is the Proportional variance. On the right is the Proportional variance after deformation. The right side has a variant of "dividing both sides by X".
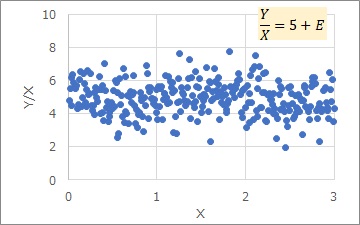
The right side shows that the variation of the vertical axis is constant regardless of X.

The right-hand side of this equation is "a certain value a with variation". For a normal distribution, this is equivalent if the mean of the distribution is a and the standard deviation is E. In other words, the variable Y/X can be represented by an ordinary normal distribution. It can be said that a Proportional variance is a type of Made by Normal Distribution But Not Normal Distribution.
If you try to estimate the sizes of a and E just by the appearance of the graph, the graph before the deformation cannot be calculated by thinking "because the slope is about this ...", but E is a little difficult.
In the case of the transformed graph, first of all, since the center of variation in the Y direction is about 5, "a is estimated to be 5". As for E, if we consider it as a variation centered on 5, it is roughly 1, so "E is estimated to be 1".
At first glance, the Proportional variance is difficult to handle, but with a slight modification, it can be treated as an ordinary normal distribution. This simplicity is very powerful for understanding phenomena.
leads
.
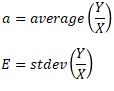
When actually finding it, first create a variable called Y/X using Y and X of the data. The mean and standard deviation of this variable are the coefficients you want to find.
I wrote that "the equation assumed by a general simple regression analysis is different from the Proportional variance," but it can also be handled with a simple transformation.
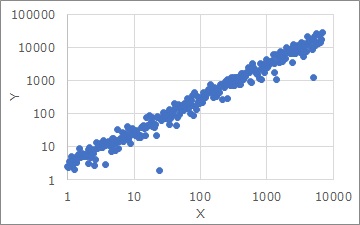
In the graph above, the left side is before deformation, and the right side is a logarithmic axis (bilogarithmic graph).
Logarithmic makes the plot almost aligned, and the variation in the Y direction appears to be constant. Therefore, it can be modeled with a typical simple regression analysis.
In the case of the logarithmic approach, the good thing is that the more X increases, the more Y increases, and the way it increases is expressed in a straightforward manner. However, in the case of this approach, simple regression analysis reveals three parameters: slope, Y-intercept, and Y direction variation. The physical implications of this, I don't know.
If you transform the Proportional variance to become just a normal distribution, it is very good that the consideration of the physical meaning is very simple. The point that "the more X there is, the more Y there is" is difficult to imagine.
If you compare creating a Y/X variable with creating a log(Y) and log(X) variable, the effort is not much different, but what you can see from it is quite different.
R-EDA1
has the funciton to analyze Proportional variances.
NEXT  Regression analysis of Constant variance
