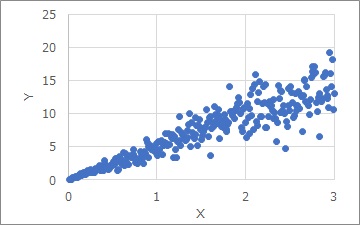
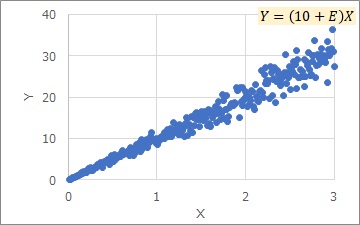
The Proportional variance is a distribution as shown in the graph above. The larger the X, the greater the variation in the Y direction.
The Proportional variance is a distribution as shown in the graph above. The larger the X, the greater the variation in the Y direction.
The larger the scale, the greater the variation, which can lead to this distribution. Even data from measuring instruments can have such a distribution.
Generally speaking, "proportionality" is a relationship in which the larger X is, the larger the Y,
and can be expressed by the equation
Y = a * X
The "Proportional variance" is not only proportional to X and Y, but also the variation in the Y direction is also proportional to X.
"Proportional variance" is the name given by the author. There doesn't seem to be a name in the world, so I added it, but if there is, I'm going to match it.

The Proportional variance is expressed by the above equation. A is tilted and E is variation. By multiplying E and X, it is expressed that if X is large, the variation in the Y direction increases.
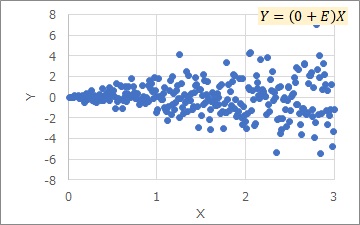
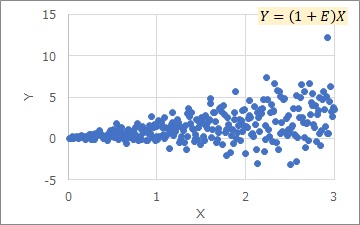
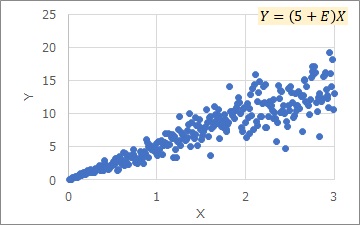
Here, E is constant. Depending on a, the appearance will change a lot.
The Proportional variance is a classification that focuses on being proportional, so there is no specific shape for the distribution of E. In practice, the most common distribution is the normal distribution, and I think the next is a uniform distribution.
I examined the question "What is a Proportional variance?"

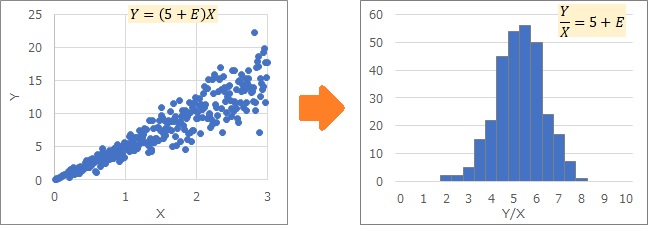
The Proportional variance is given above by dividing both sides by X.
The meaning of this equation is that the variable Y/X has a center and E variability.
For example, "Y/X is normally distributed" means the same thing. In statistics, what is called a probability distribution is, for example, the view that "Z is normally distributed". In the case of a Proportional variance, the Z part is made up of two variables, Y/X.
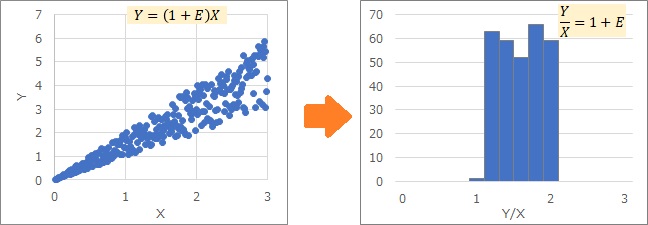
The two examples below are both histograms of variables on the right side of Y/X. If you transform the Proportional variance, you can see how it becomes normal or uniform.
General screws basically differ in length and diameter in units of 1 mm. Therefore, whether the screw is made properly depends on the application, but it is necessary to control it with an error of 0.1 mm or less.
When creating a course for a 50-meter run, I think it is common to allow an error of 1 m or less for applications such as measuring physical strength at a school.
Thus, in general, the larger the reference value, the greater the allowable variation. It seems that the Proportional variance can also be used as a mathematical theory to express such properties.
Moving large objects requires a lot of energy. When a large object is moved, the inertial force is also large, which makes it difficult to position. It seems that Proportional variance can be used as a mathematical science to express such properties. In fact, as described in Quality Engineering Approach to Proportional variance, Proportional variance often appears in the field of quality, so how to handle it has been studied for a long time.
The Proportional variance E can be any distribution.
a is the slope and E is the standard deviation. If you put values in a, E, and X, you will get Y.
=NORMINV(RAND(),a * X, E * X)
or
= X * NORMINV(RAND(),a, E)
For a uniform distribution, E is the range of variation (the difference between the maximum and minimum values).
= X * (a + E * RAND())
The Proportional variance has several applications.
NEXT  Statistical Value
