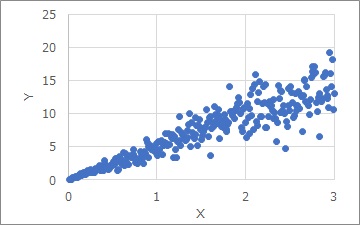
The Proportional variance is the distribution as shown above. The larger the X, the greater the variation in the Y direction. A statistical approach to this is in the Regression analysis of Proportional variance .
The Proportional variance is the distribution as shown above. The larger the X, the greater the variation in the Y direction. A statistical approach to this is in the Regression analysis of Proportional variance .
In the field of quality Proportional variance comes out well. Quality engineering also has a method of analyzing Proportional variances. There are two approaches to classifying characteristics: desirable characteristics and dynamic characteristics.
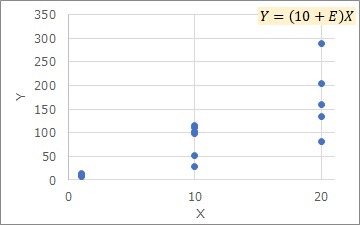
When treating it as a desirable characteristic, the values of the horizontal axis of the Proportional variance are not used. The group with a constant horizontal axis value is considered a "level" and the signal-to-noise ratio is calculated for each level.
The signal-to-noise ratio of the desired characteristic divides the variability of the data by the magnitude of the mean. For example, in the case of the Proportional variance itself, as described above, even if the appearance variation is different, the signal-to-noise ratio is evaluated as "equivalent".
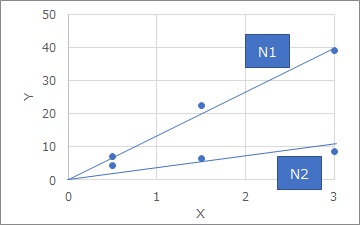
When dealing with error factors of dynamic characteristics, for example, as shown in the figure above, the relationship between Y and X is examined for each of the error factors N1 and N2.
When using the error factor of dynamic characteristics, the slope varies depending on the error factor, and we are dealing with a situation like a Proportional variance.
The larger X is, the greater the variation in the Y direction, and when you try to evaluate it with an error factor, it is not always as shown in the graph above.
In the graph above, it is assumed that the data are almost aligned for N1 and N2 alone. If there is an error factor that is the property itself that "the larger X is, the greater the variation in the Y direction", this may happen. For example, if the size of the device changes slightly depending on the outside temperature, the variation may be caused.
However, even if there is a possible error factor, it does not necessarily mean that it is what is affecting the slope.
Both of the above methods approach a Proportional variance, but they do not treat this distribution as a system.
If you want to refer to the Proportional variance Regression Analysis page as Characteristics and SN Ratio, which are often used in quality engineering, I think that the SNR ratio and sensitivity of the Proportional variance are as follows. As for the signal-to-noise ratio and sensitivity of dynamic characteristics, as shown on the Relationship between characteristics and SN ratio page, other things have been proposed, but I think this is a scale that can evaluate what you want to evaluate the most.
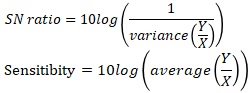
In quality engineering, "X" is often written as "M". Variance is variance and average is average. In quality engineering, the words "variance" and "average" are often used directly.
NEXT  Energy ratio type and fluctuation ratio type
