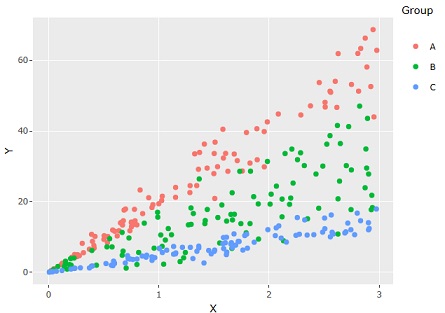
This page is about data like the one above. There are three groups, which are the same and spread from 0, but spread in different ways.
This page is about data like the one above. There are three groups, which are the same and spread from 0, but spread in different ways.
Looking at a Linear Mixed Model, you can create a model taking into account that "groups have different slopes".
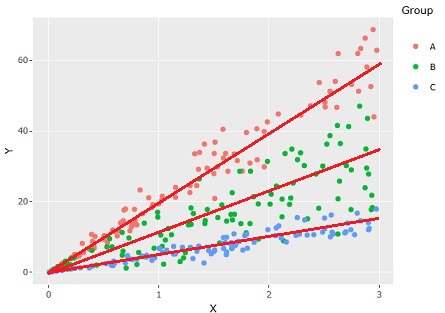
For a linear mixture model, equal variance is assumed, so It is not a model that does not fit the characteristic that "the larger the X, the greater the variation in the Y direction". If you only want to focus on differences in slope, you can use a linear mixed model, but you can't analyze variability.
If we make Y the histogram only, we can see that the spread in the Y direction is different.
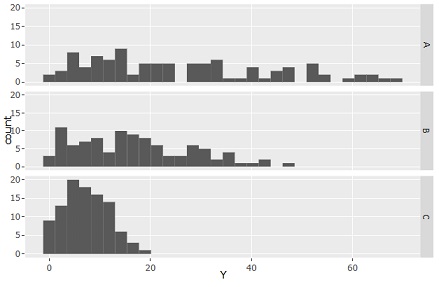
You can analyze the difference in variation. "The larger the X, the greater the variation in the Y direction" is no longer visible.
It seems abrupt, but I created a variable called Y/X and made it a histogram.
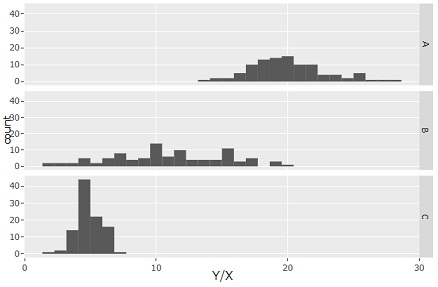
Then, the difference in slope of A, B, and C can be expressed by the difference in the center of distribution, and the variation of B is the largest, and the state where C is the smallest can be expressed. This is an application of Regression analysis of Proportional variance.
If there is a Proportional variance behind the mechanism of the data, then the histogram of Y has It includes both the property that "the larger the X, the greater the variation in the Y direction" and the property of "the greater the slope". Therefore, the slope is the largest, and the variation of A is the largest.
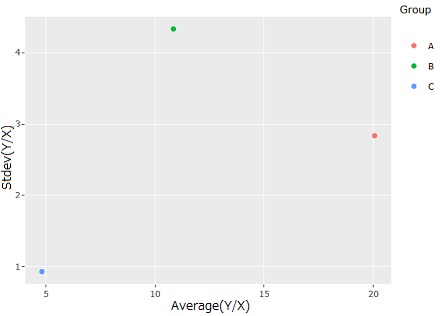
By looking at the variable Y/X, you can separate the difference in slope from the difference in variation. Therefore, in terms of Proportional variance variation, we can see that B variation is the largest.
If the horizontal axis is the mean value of Y/X and the vertical axis is the standard deviation of Y/X, the information that can be understood from the histogram can be expressed in a simple graph. This method is useful if you have many groups.
NEXT  Proportional-proportional variance model
