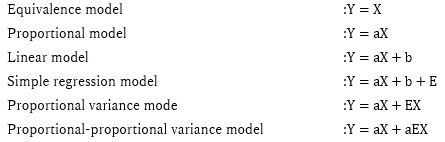
"Proportional proportional distribution model" is a term coined by the author. The phrase "proportional proportionality" is not a typographical error, but comes from a place of doubly proportion.
Proportional variance is similar, but slightly different. The product of E and X is the proportional variance, but in proportional proportional variance, the slope a is further multiplied.
When there is only one proportional variance, the proportional variance model and the proportional variance model cannot be distinguished unless the original E is known. If there are multiple proportional variances, such as the Linear mixed model of Proportional variance, the relationship between them may be explained by the proportional variance model.
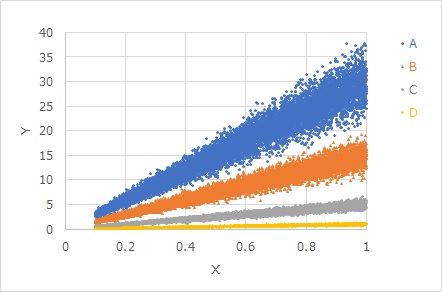
In the graph below, A, B, C, and D, the magnitude of E is the same, only the slope is different. The size of E is the same, but the slope is multiplied, so the larger the slope, the greater the variation in appearance.
The proportional and proportional variance model is determined only by the slope a and the magnitude of the variation, E. Each of these is obtained by the following equation:
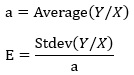
A can be obtained by creating a variable Y/X and calculating the average value of it. E is also obtained by calculating the standard deviation of the variable Y/X and then dividing it by a.
This method is an application of Regression analysis of Proportional variance.
Suppose you want to find out, "When there are two or more proportional variances, are they not related to the proportional proportional distribution model?"
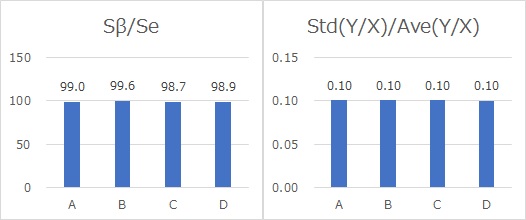
As shown on the Dynamic SN Ratio page, Using the scales Sb/Se and Ste(Y/X)/Ave(Y/X), we can investigate the hypothesis that E should be the same. If the values on these scales are approximately the same, then "E is considered to be the same".
If we calculate the case of the graph above, it will look like the following. It can be confirmed that E is common, and the proportional proportional distribution model applies.
For the proportional and proportional distribution model, Many people may think, "Isn't there no data that fits such a model in reality?"
Certainly, data that is in a proportional and proportional distribution model It doesn't come up in general data science, but in quality engineering, it's been commonly known for decades.
A scale for evaluating the proportional and proportional variance model as described above has been proposed by Quality Engineering.
In quality engineering, evaluating data using the signal-to-noise ratio of dynamic characteristics has been studied for a long time. There seems to be no research in the direction of deriving model equations.
On this page, we introduce the equation
as a proportional proportional distribution model,
proportional regression which is what I came up with. It's not difficult, so it's not surprising that there have been previous studies, but it doesn't seem to be as far as I know.

Once the model equation is created, it is possible to predict and simulate.
The way to write at the beginning of this page is to write a proportional, proportional, and variance model in a way that looks like an additive model.


If we consider (e.g., a normal distribution with a mean value of 1),
then

we can say that it is a Multiplicative model of Errors.
On the Additive model and multiplicative model page, there is a conversion between the two, but it is different. Since E is the variation of the residuals, it is easy to imagine that it is a distribution with a mean value of 0, but if it is okay to have a mean value other than 0, it will be a multiplicative model.
Mathematically, the proportional proportional variance model can be expressed as a multiplicative model, but in practice, it is better to think of the proportional proportional variance model in the form of an additive model. This is because in the form of an additive model, it is possible to decompose and consider the parts of the graph that appear as slopes and parts that appear as variations.
NEXT  Generalized proportional variance model
