Y = b X + E
. A and b differ only in b, with E in common. There are also two types of X regions. That's why it's in four groups. Even if the b is different, the variation in appearance is the same.
Classification of Characteristics page describes the eight types of dynamic characteristics. This page describes the signal-to-noise ratio suitable for measuring each dynamic characteristic. However, unfortunately, not all.
Note that such an explanation of dynamic characteristics does not appear in the quality engineering literature. When I looked it up, I thought that this form was the best, but if there are any deficiencies, I will fix them.
The signal-to-noise ratio of quality engineering is a scale designed to calculate that "small variability = large signal-to-noise ratio". If there is a "-" in front of log, it is a measure of "small variation = large number".
R2 is ratio data from 0 to 1, so if you want to use it as an SN ratio, it is better to use odds (omega conversion).
Dealing with data such as dynamic characteristics is called regression analysis in general statistics.
In regression analysis, the magnitude of variation is determined by residuals or by using R and R2. It is normal to assume equal variance, and we do not think that "variance is proportional to the slope".
In the above classification, the methodology is organized for areas that are not assumed by general statistics and that conventional quality engineering has begun to enter.
Regarding the signal-to-noise ratio of static characteristics, the relationship between the characteristics and the corresponding signal-to-noise ratio has been introduced in various literature. On the other hand, there seems to be no such classification in the world for dynamic characteristics. (As far as I know)
There is one literature that explains that "in the case of proportional variance, the variation ratio type is suitable", but there seems to be no one that goes into the above classification.
Therefore, the result of the author's investigation is the correspondence described above.
Here's how we looked it up: For each characteristic, we have prepared four groups of data. If the values are the same in the four groups, it can be quantified that the characteristics are the same.
In addition, it is very difficult to think of encountering proportional variance characteristics 3 and 4 in practice, and even if I did, I did not investigate them because it would be better to shift the data and make them proportional variance characteristics 1 and 2.
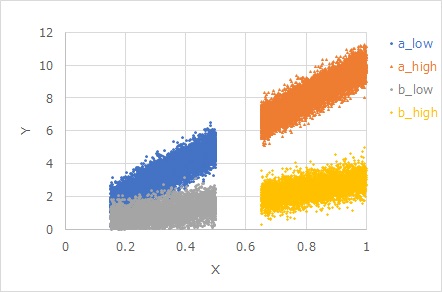
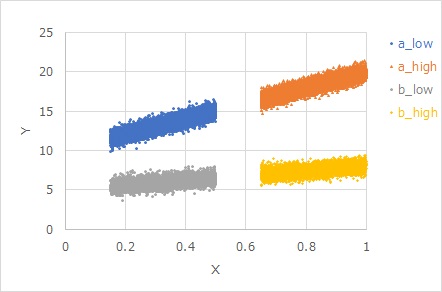
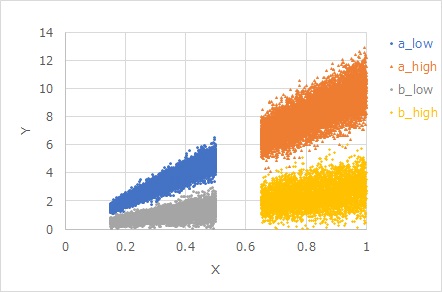
Equal variances, unlike proportional equal variances, have the same variation, even if the slopes are different.
The figure below shows
the data created by the equation
Y = b X + E
. A and b differ only in b, with E in common. There are also two types of X regions. That's why it's in four groups. Even if the b is different, the variation in appearance is the same.
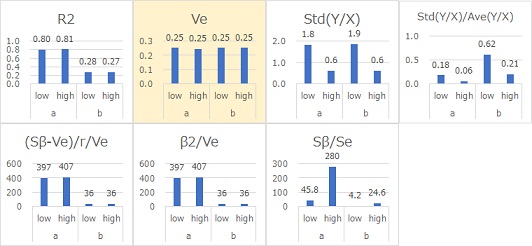
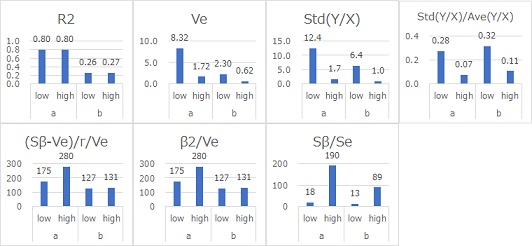
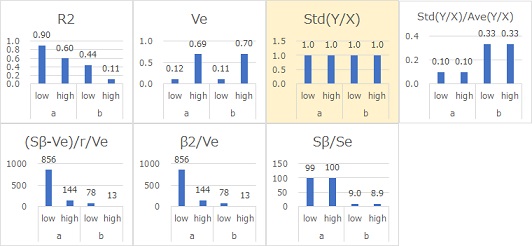
The signal-to-noise ratio is the same for Ve. It turns out that Ve is suitable as a signal-to-noise ratio.
Note that Ve is a direct measure of how large the equal variance is.
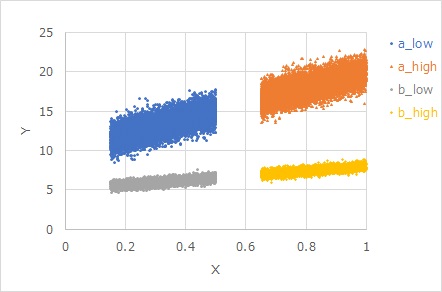
The figure below shows
the data created by the equation
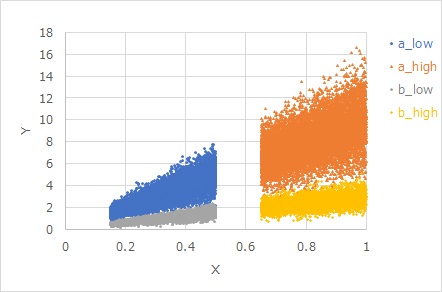
Y = b X + b E
. A and b differ only in b, with E in common. Even if the E is common, the b is multiplied, and the larger the b, the greater the variation in appearance.
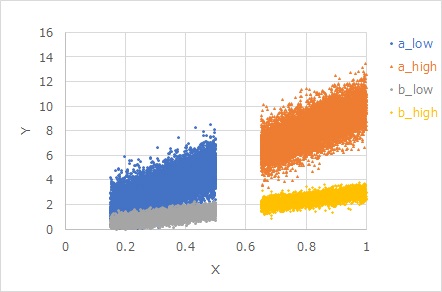
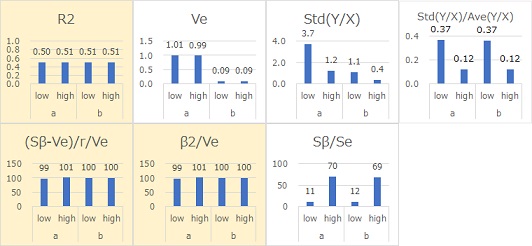
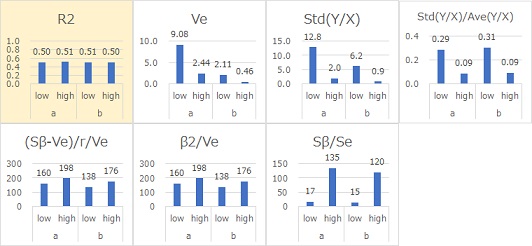
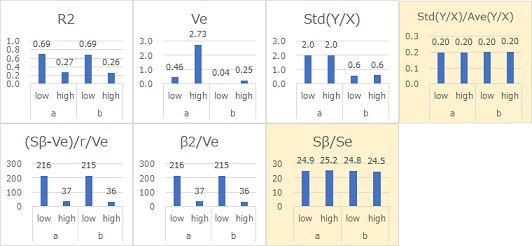
Ve represents the distance (residual) of Y from the straight line. If it is 0.99 for Ya and about 0.09 for Yb, we can see that the standard deviation is 1 and 0.3 of their square roots. In the case of equal variance, Ve is a direct representation of the variation.
R2, (Sb-Ve)/r/Ve, b2/Ve, and Sb/Se have almost the same signal-to-noise ratio. R2, (Sb -Ve)/r/Ve, b2/Ve, and Sb/Se were found to be suitable signal-to-noise ratios.
The figure below shows
the data created by the equation
Y = b X + E X + c
There was no signal-to-noise ratio suitable for the evaluation of the uniform dispersion characteristic 3.
The data below is
created by the equation
Y = b (X + E).
R2 has approximately the same signal-to-noise ratio. It turns out that R2 is suitable as the signal-to-noise ratio.
The figure below shows
the data created by the equation
Y = b X + E X
. It is proportionally distributed. A and b differ only in b, with E in common. Even if the b is different, the same X has the same visual variation. The larger the X, the greater the variability in appearance.
Std(Y/X) has approximately the same signal-to-noise ratio. Std (Y/X) was found to be a good signal-to-noise ratio.
Since Std(Y/X) directly determines the form of proportional variance, this value directly represents the magnitude of the variation.
"Proportional proportional distribution model" is a term coined by the author. The variation at the same X is proportional to both the X value and the slope b value.
The data below is
created by the equation
Y = b X + b E X
. It is a proportional, proportional, and distributed model. A and b differ only in b, with E in common. Even if the E is common, the b is multiplied, and the larger the b, the greater the variation in appearance. Also, the larger the X, the greater the variability in appearance.
Sb/Se and Ste(Y/X)/Ave(Y/X) have almost the same signal-to-noise ratio. It was found that Sb/Se and Std(Y/X)/Ave(Y/X) are suitable signal-to-noise ratios.
Since Std(Y/X)/Ave(Y/X) directly determines the form of proportional proportional variance, this value directly represents the magnitude of the variation.
NEXT  History of Dynamic SN Ratio
