"Generalized proportional distribution model" is a term coined by the author. It is a generalization of Proportional-proportional variance model, but it is also a special form of Generalized Linear Model.
When there is only one proportional variance, the proportional variance model and the proportional variance model cannot be distinguished unless the original E is known. If there are multiple proportional variances, such as Linear mixed model of Proportional variance, the relationship between them may be explained by the proportional variance model.
The generalization of the proportional variance model is that the aX part of the proportional variance is OK as long as it is a function of X.
The special thing about generalized linear models is that in generalized linear models, the error part is a function of some of the inverse link function f(X) of X.
The generalized proportional variance model assumes only that the distribution in E is proportional to f(X). A similar example is Poisson regression analysis. Poisson regression analysis assumes a Poisson distribution as E, but the standard deviation of the Poisson distribution is the square root of f(X).
In Quality Engineering, there is an evaluation index called Standard SN Ratio, and the nonlinear data that we are trying to measure with Standard SN Ratio is exactly what the generalized proportional variance model applies.
In the graph below, you can see how the variation in the Y direction increases when the Y is large.
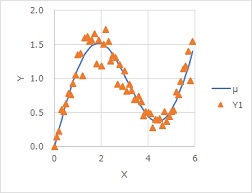
Quality engineering proposes to convert nonlinear data into a graph with the standard state on the horizontal axis as a way to analyze it. In the graph above, if you do this conversion, it will be below. The standard state is the u of the average value of each X. u is the part of Y=f(X).
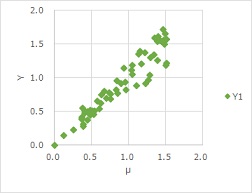
This transformation allows the data to be arranged linearly and proceeded as Regression analysis of Proportional variance. In quality engineering, this is evaluated by standard signal-to-noise ratios.
NEXT  Gaussian Process Regression Model
