For example, the data will look like the figure on the left above. This is the case when YN is the standard state and Y1 is the changed condition.
The standard signal-to-noise ratio is often mistaken for a "standard signal-to-noise ratio" because it has "standard" in its name. Also, in the signal-to-noise ratio, it was considered relatively later. It seems that it is easy to misunderstand that "a better signal-to-noise ratio than the conventional signal-to-noise ratio".
In fact, it's neither. The signal-to-noise ratio is a signal-to-noise ratio that can be used to evaluate the robustness of a standard state and to evaluate nonlinear dynamics.
A standard state is a state that is considered (determined) as a standard (standard). For example, the value given by the reference device. Also, if there is a disturbance that occurs suddenly in a process that is moving under predetermined conditions, The absence of disturbances is the standard state.
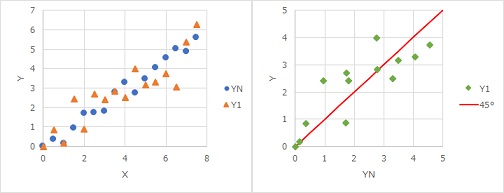
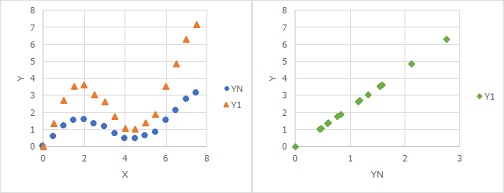
For example, the data will look like the figure on the left above. This is the case when YN is the standard state and Y1 is the changed condition.
As a robust design, we aim to be the same as the standard state, so we need to evaluate this change.
This evaluation is shown in the figure on the right above. The horizontal axis is YN in the standard state, and the vertical axis is Y1. Then, you will be able to evaluate only the difference in Y without worrying about X. In the figure, there is a line "45 degree", and if YN and Y1 are exactly the same, then the dots will line up on this line. The degree of deviation from this line indicates how the data varies.
A standard state is a state that literally becomes standard, if there is one.
Even if there is no standard state, if there is data for two or more conditions, there is a way to put the average of those conditions as the standard state. In this case, it's a way to look at the variation from the average.
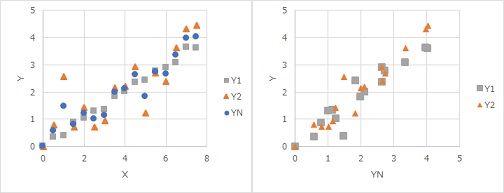
In the figure above, the average value of Y1 and Y2 is YN. This is the case when there are two conditions. In the figure on the left, Y1 appears to have more variation from the straight line, but in the figure on the right, both Y1 and Y2 look similar. This is due to the fact that you are taking averages.
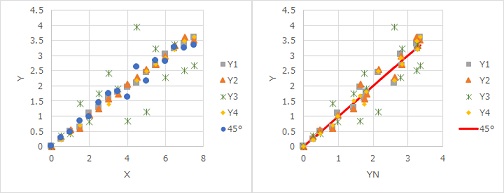
The method of using the average value as a standard state does not have much advantage when there are two conditions, and it seems to have an advantage as a method of looking at the difference in conditions when there are three or more. The example below is for 4 pieces. Compared to Y1, Y2, and Y4, the figure on the right shows that the variation of Y4 is larger.
The robustness evaluation of the standard state can also be evaluated by the correlation coefficient, as described in Application of Suspected Correlation. As a measure to be used when analyzing experimental data, quality engineering has proposed a standard signal-to-noise ratio.
There is an SNR ratio of dynamic characteristics in the relationship between characteristics and signal-to-noise ratios, but the standard signal-to-noise ratio uses Y in the standard state instead of X.
This usage is the same as Application of Suspected Correlation.
As a further data analysis of dynamic characteristics experiments, the concept of standard state analysis can be used. It could be said that it is the second stage of analysis.
First of all, we analyze the experiment of the dynamic characteristics normally and find the best conditions. And the best conditions are considered to be standard conditions. You can then use the standard state analysis to compare the best conditions with other conditions.
As described in Dynamic Characteristics and Non-linearity, the signal-to-noise ratio of dynamic characteristics cannot be evaluated when there is a nonlinear relationship between X and Y.
By the way, in the robustness evaluation of the standard state, we look at the relationship between the Y of the standard state and the Y of another condition. At this time, the relationship with X is no longer affected, so even if X and Y are non-linear relationships, the robustness of the standard state can be evaluated. In other words, the standard signal-to-noise ratio is a method for evaluating nonlinear dynamic characteristics.
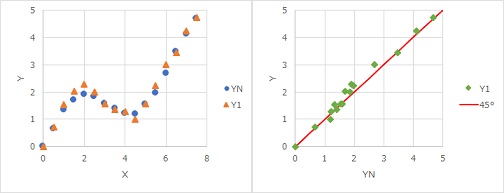
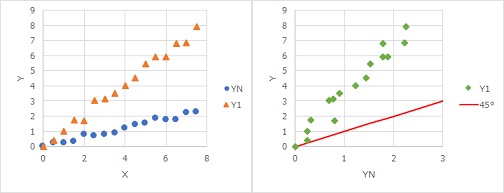
For example, in the figure on the left below, X and Y have a nonlinear relationship. The relationship between the standard state YN and Y1 alone is shown in the figure on the right. Since the data are arranged in a straight line, it can be seen that the variation from the standard state can be evaluated by the correlation coefficient and the standard signal-to-noise ratio.
Another example of non-linear alignment of data is in the following cases:
If the variation increases in proportion to Y, the data are aligned.
The fact that X and Y can have a nonlinear relationship is true not only when X is quantitative data, but also when it is qualitative data.
I wrote that "the standard signal-to-noise ratio is a method for evaluating nonlinear dynamic characteristics," but I did not investigate the relationship between X and Y.
There are various "nonlinear relationships". If you use it for nonlinear relationships, you will need to deal with it on a case-by-case basis. It is a response such as "take an appropriate level while looking at the graph".
We are looking at the difference in Y due to different conditions, but we are not looking at what X is doing at that time, so in some cases we need to check the relationship with X.
The standard signal-to-noise ratio is useful, but it seems that it is easy to misuse it if it is understood only in terms of "seeing the relationship with the standard state" or "being able to evaluate nonlinearity".
As shown below, the point is whether the difference from the standard state is only the way it varies. This point cannot be understood by looking at the numbers in the data or the signal-to-noise ratio, so it is better to check it in a graph.
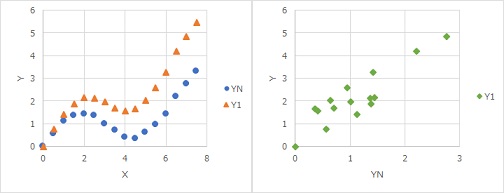
First of all, in the case of the figure on the left above, it will vary in a different place from the 45 degree
line as shown in the figure on the right. The difference between the standard state and Y1 is not only the way it varies.
The standard signal-to-noise ratio cannot be evaluated in a nonlinear manner in the case shown in the figure above. If the variation is large in proportion to X, the data will not be aligned.
As a result, the standard signal-to-noise ratio is no longer valid.
In quality engineering, there seems to be no research on what kind of formula the data that we are trying to evaluate with the standard signal-to-noise ratio is made of. The Generalized proportional variance model is such an equation that I came up with.
NEXT  Quality Engineering Approach to Proportional variance
