Statistics has many methods using the normal distribution and Others.
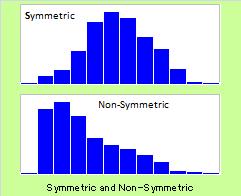
If the distribution is non-symmetric, it is difficult to judge outliers because there is the long tail.
In such case, other distributions and non-parametric are solutions. But if we can use the methods for the normal distribution, it is good.
If we find the mechanism between the real data and normal distribution, it might be a breakthrough for the data analysis.
I collect the mechanisms that I met before in my real jobs.
There are sample file to show my method to make the data in this page. But it is small size.
The data n =100000, Average = 10, Standard deviation =1.
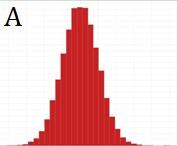
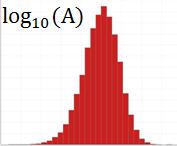
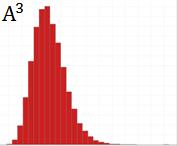
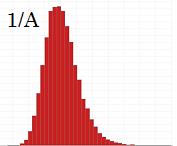
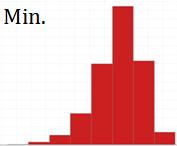
Not clearly, but it is the non-symmetric distribution. Right side is longer.
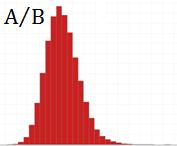
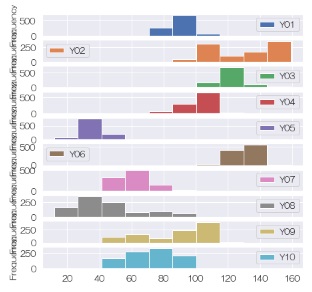
1000 sets of normal distribution. N = 200, Ave. = 10 and Standard deviation = 1 for each set.
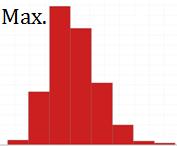
The distribution of data created by the
random walk model
is far from the normal distribution, but it is still a type of distribution created from the normal distribution.