Gage R & R is a method for assessing the ability to measure.
Suppose you have a measurement method that makes repeated measurements with a standard deviation of 0.1 mm. Gauge R & R is a method for determining whether or not this "standard deviation of 0.1 mm" is sufficient for the desired capacity. For example, it may be more than enough to measure the size of a lake, but I think it is not enough to measure the inside of electronic components.
Regarding whether the measurement capacity is sufficient, in the above example, the approximate size of the object to be measured is used as the denominator, and the standard deviation of repeated measurements is used as the numerator.
At the time of this calculation, if it is smaller than 0.1, it seems to be good to judge that "the ability is sufficient", but it is "not good at all" that was larger than 1.
Gauge R & R is known as the official method in the manufacturing industry, although it is possible to evaluate the measuring ability in this way without using gauge R & R.
Gauge R & R has two R's, Repeatability and Responsibility. In the above, we only talked about repeatability as a measurement ability, but gauge R & R also evaluates reproducibility.
Repeatability is simply the error when the same measurement is repeated. Reproducibility is said to be an error due to different measurers, but it can also refer to an error in the entire process of preparation for measurement.
Gauge R & R evaluates the ratio of the standard deviation, which is the sum of repeatability and reproducibility, to the range you want to measure.
Specifically, several samples are measured by multiple measurers the same number of times.
The data obtained in this way is analyzed by two-way ANOVA . There are two duals, a sample and a measurer.
Two-way ANOVA finds three types of variation: variation due to sample differences, variation due to measurer differences (reproducibility), and variation due to repetition (reproducibility).
The overall variability is the combination of these three variability. Using the overall variation as the denominator, we will calculate and evaluate the amount of the numerator that is the sum of reproducibility and repeatability.
First, determine if the measurement method is competent. Here, when it becomes "insufficient", it is easy to see whether the cause is repeatability or reproducibility by looking at the calculation result, so the direction of improvement points is determined.
To do gauge R & R, you actually need to measure a lot of samples. If it is difficult to prepare a sample or measure it, I would like to reduce the number of experiments as much as possible, but if the number is small, the result tends to be unstable.
Since the denominator is the overall variation, if the variation due to the difference in the sample is small, it is easy to get a bad evaluation. Therefore, how to choose a sample is important.
As a guide, you can select the sample so that it falls between the upper and lower limits of the range you want to measure.
Another way to avoid worrying about changing the denominator when selecting a sample is to use a tolerance (difference between the upper and lower limits of the standard value: Tolerance).
There are measured values ??in the world, such as the number of defects, that the larger the number, the larger the measurement variation. Gauge R & R implicitly assumes homoscedasticity, so it may be necessary to devise a sample selection method depending on the object.
It is important to measure whether the number of defects is 0, but if you perform an analysis that contains a sample with 1000 defects, it will deviate from the purpose.
Since it uses two-way ANOVA, it seems that there is nothing you can do if you want to do it in Excel. Some people have published tools that use Excel.
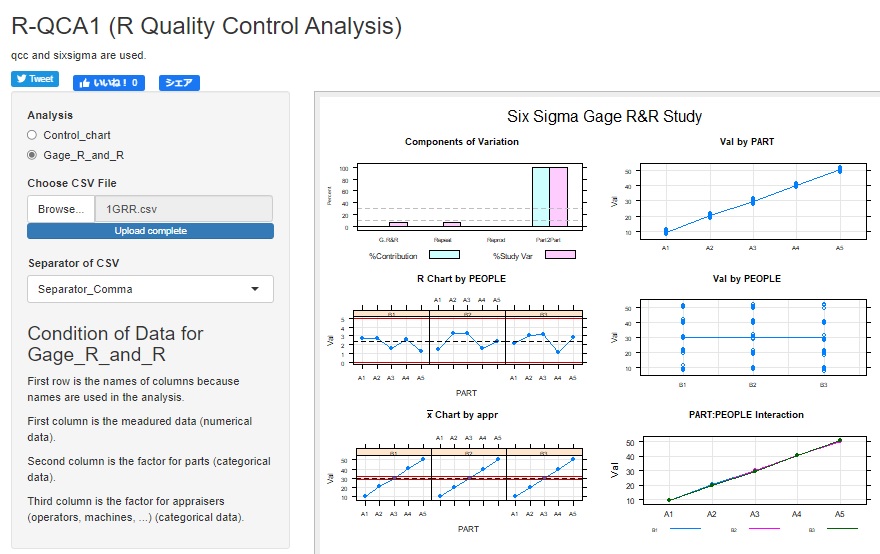
I think R-QCA1 is the easiest way to try gauge R & R. If you prepare a CSV file that contains the measured values ??in the first column, the sample name in the second column, and the name of the measurer in the third column, you can easily obtain the results.
NEXT  Causes of Errors
