Factory sensor data includes a quasi-periodic type and a flow type, but this page is about the quasi-periodic type.
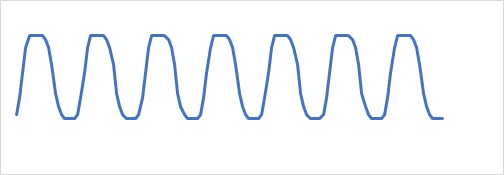
Periodic data that is not quasi-cyclic is like the following: If the data is held against the background of four seasons or a regular cycle such as 24 hours, it will be close to this.
On the Time Series Analysis page, I wrote that Self Correlation Analysis and Spectrum Analysis are explained in the general explanation of time series analysis, but these theories use formulas created on the assumption of periodicity.
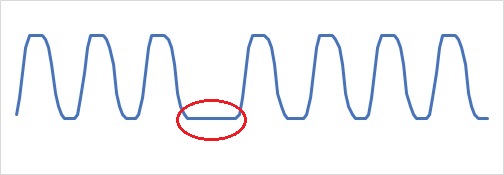
Quasi-periodic data look similar, but theories based on periodicity cannot be used.
Rather, when I want to look up something in quasi-periodic data, I often want to know the difference between something that is not cyclical, so I take an approach to know it.
Quasi-periodic data has complicated relationship and changing. So when we bring the data from database without any ideas, and put into multi-Variable analysis and data mining software, we cannot get what we want study.
I introduce the analysis of sensor data by the way, type 1, 1.5, 2 and 3. In these types basic tool is line plot.
It is not a high level tool. But it is useful the data we do not know the contains.
Repeat type is easier. So I write repeat type at first.
We need the idea of sampling and calculations before analysis.
I'm making an example using R and Python.

