 Analysis of Type 1.5
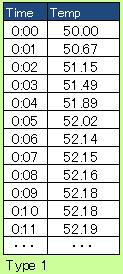
"Type 1" is the sensor data made by sampling from database .
The figure is an example data sampled every 1 minute. It is only two rows, time and temperature.
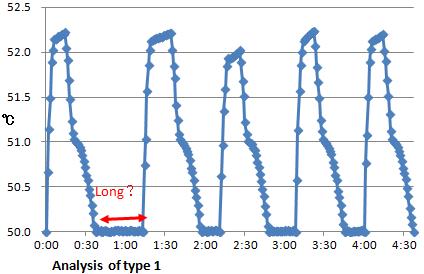
The line plot is the first step of the analysis. The example shows the cyclic change.
If there are categorical data in the column of quantity data, or blank data or the columns only including categorical data, it is needed to check the tables of the data. We may find the special data.
If the model can approximate the phenomena to study, Condition Analysis , Self Correlation Analysis , Moving Analysis and Spectrum Analysis may be useful.
Tools of Multi-Variable Analysis and Data Mining may be useful to study total view of the type 1 data.
NEXT Analysis of Type 1.5
