Data collected by temperature sensors, brightness sensors, etc. is called sensor data.
In particular, the "sensor data" handled on this page is It is a fixed-point observation and continuous measurement at a cycle such as every second or every minute. In the field of environmental science, it is used to constantly monitor places that are difficult for people to enter, and in the field of quality science, it is used to manage factories. The data of the power monitor used for energy saving in buildings is also sensor data.
Analysis of sensor data is a typical example of time series analysis.
30 days is 43220 minutes (30 days * 24 hours * 60 minutes), so 30 days of data per minute is 43220 rows. If you try to handle this amount of money on a general computer, you will not be able to do it "instantly" depending on the processing. This is the situation with data every minute, so if you try to take more detailed data to see instantaneous changes, it will be even more difficult.
Also, when analyzing sensor data, there are times when you want to focus on the relationship between many sensors. The data in the above rows will increase by the number of sensors.
"Big data" is in the spotlight in the world. Sensor data is also big data.
Factory sensor data looks quite different depending on the production method, and the approach is also different.
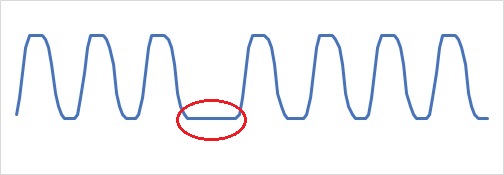
In the case of bread making, the quasi-periodic type is the temperature data of the oven when the bread is taken in and out of the oven and baked. In factories, it is a production method called the batch type. This applies not only to factories, but also to the data of repeated phenomena in which events are repeated.
There are variations in the time of baking bread and variations in the time of putting in and taking out bread, so it is a quasi-periodic type.
There is no precise period like vibration data or electrical signals. Spectrum Analysis cannot be used to analyze accurate periods. The key to the analysis is to quantify the variation in parts that are not accurate periods in Quasi-periodic Data Analysis.
The flow type is the oven temperature when baking while passing through the oven in a tunnel oven. In factories, it is a production method called continuous. Bread is solid, but it is often used in chemical factories and other methods where the product is a gas or liquid, and it is changed while flowing to make a product. It is also called a process system.
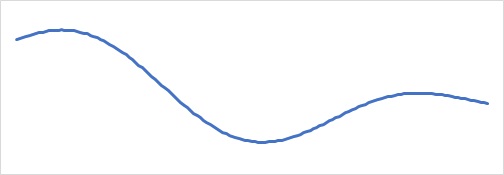
For example, if you want to analyze the relationship between weather data and events, you can also use the flow type.
Discrete production is a production method that is somewhere between batch and continuous. For example, it is a method in which one product can be produced for every rotation that rotates mechanically and regularly.
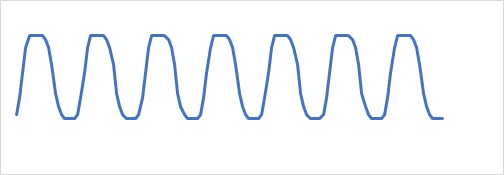
Basically, it moves mechanically and regularly, so it is quite precisely cyclical in between. Variations in time, such as those of the quasi-periodic type, are the kind of data that happens from time to time.
Therefore, the discrete method differs from the batch method in that it selects only periodic times and allows the periodic data analysis method to be used for that range. You can examine the differences in cyclical characteristics depending on the time of year. However, even if it is discrete, it is often possible to find out what you want to know by analyzing quasi-periodic data.
NEXT  TQC
TQC
