Analysis of Type 2 (Feature Data)
Analysis of Type 1
and
Analysis of Type 1.5
is the study for total view of the data.
But it is not enough to study the
Process Analysis for Abnormal Condition.
In the examples in this site, cyclic change is the shape of the
data.
So if we define the shape mathematically, the analysis will be done easily.
I call the defined data, "type 2".
Type 1 has 280 columns.
But type 2 is only 5 columns.
Complicated shape of the type 1 data is changed into rows of type 2.
Making Type 2
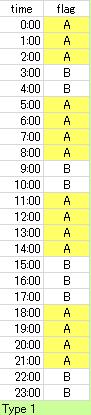
Type 1
is made by the sampling from the database.
In the making of type 2,
both sampling from type 1 data and calculating type 1 data goes together.
Sampling from Type 1
The sampling is similar to
type 1.5
.
But it is done sampling data is only 1 columns for the same cycles.
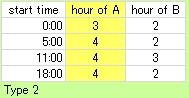
Calculating from Type 1
If we can use the start time of every cycles, various indexes can be made using the start time.
Calculating from Type 1 (Periodic data)
We calculate the difference between the two timing for the analysis of period shape.
Calculating from Type 1 (New indexes)
It is need to make some new indexes to analyze complicated shape of the data.
Analysis of Type 2
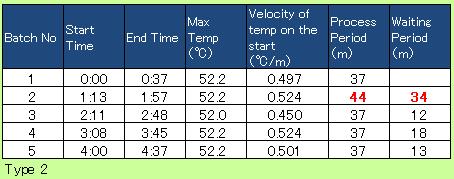
The analysis of
Loss time
is can be done using periodic data.
If we want to study the relationship among variables,
graphical modeling
,
principal component analysis
and
Associations Analysis
may be useful.
Software
EXCEL
The
sample file
is the example of programming to change from type 1 sensor data to type 2.
It is not difficult as a VBA programming.
But it is very important to analyze
sensor data.
R and Python
The page for Analysis of quasi-periodic data by R and Analysis of quasi-periodic data by Python is created to make the data.
Relatively simple secondary data (features) can be quickly advanced to the analysis stage by using R or Python. When creating secondary data that incorporates unique technology, the effort is not so different between VBA, R, and Python.
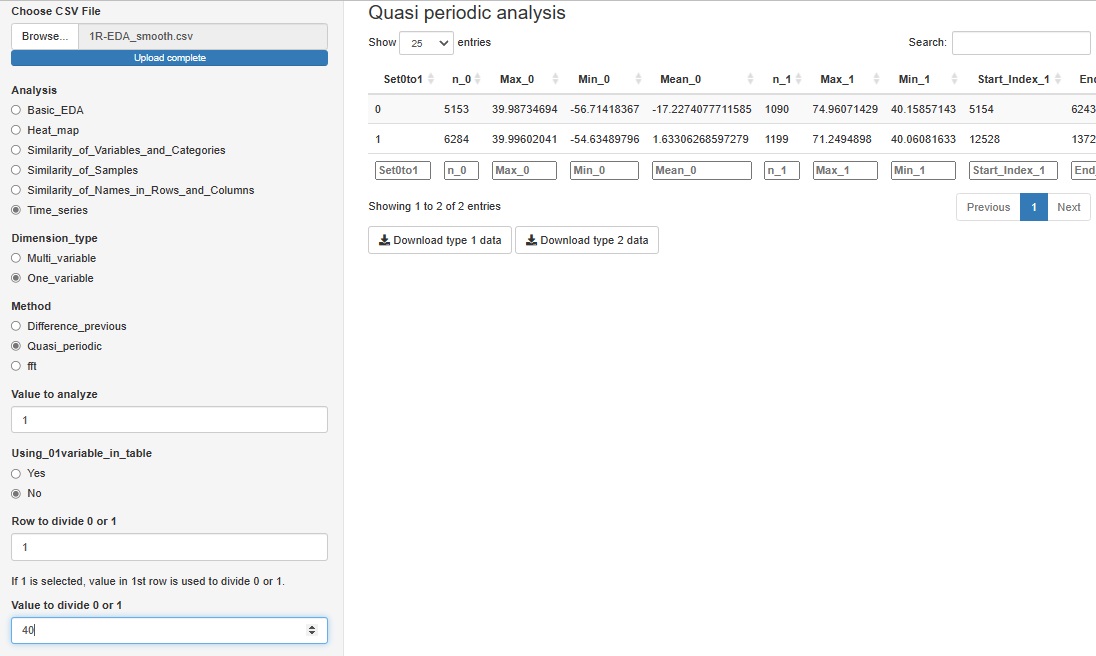
R-EDA1
With R-EDA1, you can easily create secondary data. "Quasi_periodic" in "One_variable" has no graph output and analysis data can be downloaded.
We expect to use this data for further analysis as needed.
If you have a variable whose quasiperiodicity is represented by the numbers 1 and 0, you can use it. If you don't have these variables, you can create them for a particular variable by saying "1 if the first column is greater than 40, 0 if it is less than 40".
NEXT  Analysis of Type 3
