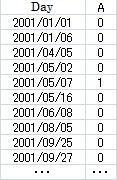
The table of the data is the example of the 0-1 data. 1 means "Yes" or "Occur".
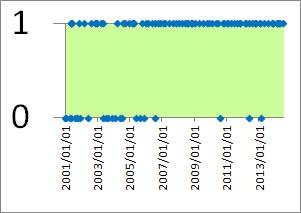
The scatter graph of this data is the figure.
You may find that there are many "1" for the right side. But this graph is not smart.
The aggregation of the data above may go well by the year because there 14 years in the data and "14" is not too small and not too large size.
There are two way of the aggregation. We need to use by the background and purpose of the data.
This way goes well for the case that "If A occurs, the report was done for all cases. And the day of "0" is not needed for the analysis."
For example, "PiVot table" of Excel is the good tools of the aggregation.
If there many variables, "Aggregate" of RapidMiner is useful.
The sum of the data of each year is the sum of the times because the day "0" does not effect for the calculated value.

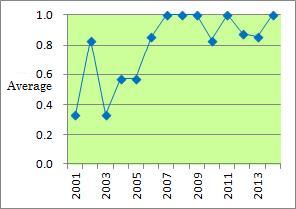
Average is also useful as the value of the aggregation.
The calculated value is the probability of the occurring. We can calculate the probability by the average because the data is 0 and 1.
The example of this page is the case for one variable.
0-1 data is often used in the fields of Associations Analysis and Text Mining. Many variables are used in these fields.
If we need to analyze many variables, line-graph is difficult to use.
Trend Analysis for Many Variables is one of the solutions of the case.
Sample file of this page.
NEXT  Sensor Data Analysis
