When the way in which data is generated in a Point Process is regarded as a Poisson distribution, that is, it occurs randomly with equal probability, it is called a Poisson process.
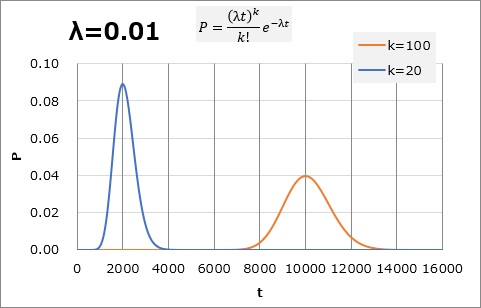
On average, if one case occurs in 100 hours (1.0), we can imagine that it will take 01,20 hours for 2000 cases and 100,10000 hours for <> cases, but we can imagine that there is a certain range of times to reach that number. Assuming the width with the Poisson distribution, it is as shown in the graph below.
If reaching 100 is 8000,12000 hours, "Is it too early?" and if it is 100,1 hours, "Is it too late?" You may be tempted to think, That much can be seen that the assumption of "one case in <> hours" is not particularly abnormal in the range of variation.
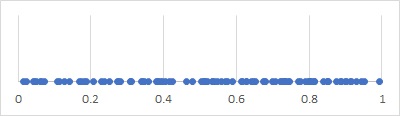
As shown above, suppose you have data that is in a Poisson process. There are 100 pieces of data. The interval is random.
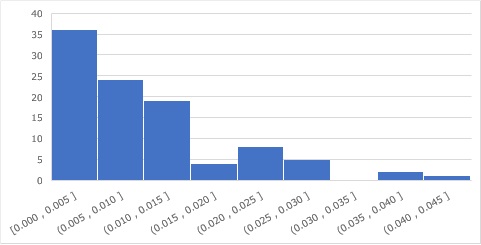
If you calculate the difference in time, create interval data, and make a histogram, you can see how the exponential distribution looks.
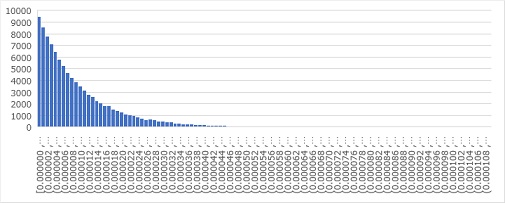
By the way, to solve the question "Isn't it an exponential distribution because it is warped?", If you do the same work with 100000 data, you will get the graph below. With this much data, you can see that just because the occurrence is random, it is not a random distribution, but a clean distribution.
In the Poisson process, there is an assumption that the probability of occurrence is constant. You can find out how to confirm this assumption on the Point Process Analysis page.

