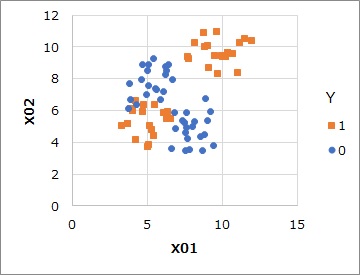
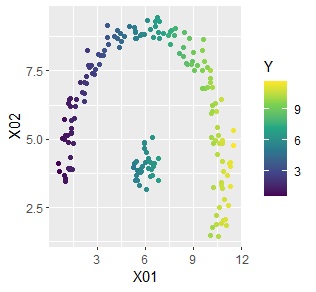
Suppose you have data like the one above. There are two Ys, 1 and 0, and there are variables X01 and X02. Y is 1 and Y is divided into two regions, and Y is 0 in between.
Vector quantization is a method of performing Cluster Analysis on data with multiple variables, finding clusters of individual samples, and using the names of the clusters as qualitative variables with categories.
Vector quantization label classification does not seem to have a suitable name in the world, so I gave it to the author. This is a method of analyzing the relationship between an explanatory variable with vector quantization and the target variable.
This analysis is similar to Discriminant Analysis and Logistic Regression Analysis.
Suppose you have data like the one above. There are two Ys, 1 and 0, and there are variables X01 and X02. Y is 1 and Y is divided into two regions, and Y is 0 in between.
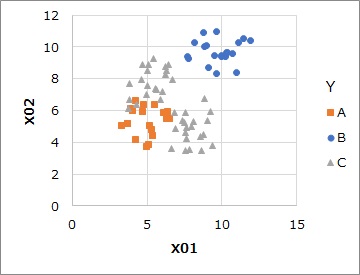
Only two explanatory variables, X01 and X02, without Y, are used for clustering. In this example, we divided it into three regions by the mixed distribution method.

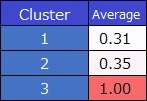
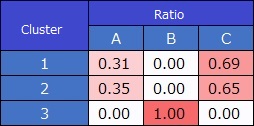
Calculates the average value of the Y value for each cluster.
Since the variables have only 1 and 0, the mean value is calculated as a percentage (probability) of 1.
This model is not good, the samples in cluster 3 are separated cleanly, but clusters 1 and 2 are ambiguously separated.
In this example, there are two explanatory variables, so for example, a sample with a scatterplot location around cluster 2 has a probability of predicting Y as 1 and therefore has a prediction value of 0.31.
When there are multiple explanatory variables, the method to find out which cluster the new sample will be is to analyze the prediction of the cluster.
Multi-value label classification
In the case of binary values, the average value is calculated. If the objective variable is quantitative, this method can be used as is.
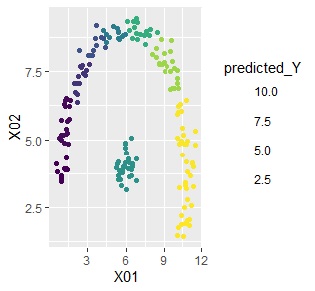
Below is the original data on the left and the predicted value on the right. If the clusters are the same, the predicted values are the same, resulting in coarser predictions.
If there is a slope in each cluster according to the explanatory variable, just an average value is not accurate. In such cases, cluster high-dimensionalization regression analysis is a good choice.
By the way, this difference is: Same as the difference between a general regression tree and model tree.
The most promising use of vector quantization label classification is prediction. It can handle even complex distributions.
Vector quantization label classification is a method with high prediction accuracy even for complex distributions, but it cannot be used for causal inference because it does not have explainability or interpretability. These features are similar to the k-nearest neighbor method. By the way, vector quantization label classification does not examine the distance between all samples, so the calculation is faster than the k-nearest neighbor method.
Another use is to analyze data bias.
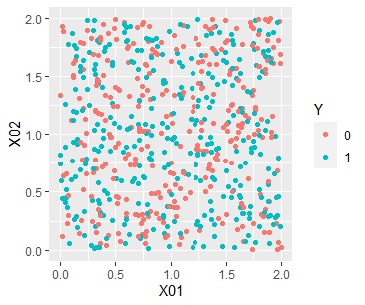
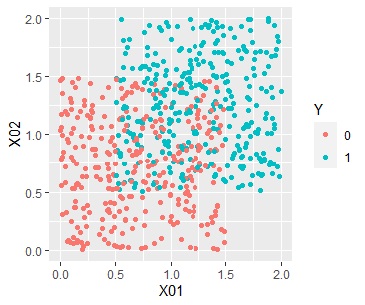
For example, suppose there are two types of distributions, one where the two values are evenly mixed as shown on the left (Data1), and the other where the regions are roughly divided (Data2) as shown on the right.
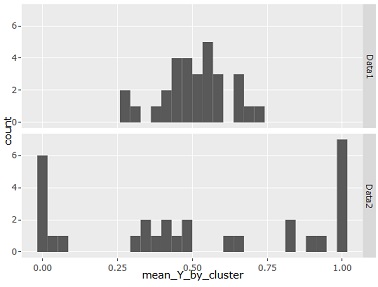
In this case, the average value for each cluster is a histogram as shown in the figure below. If there is no bias, it is often around 0.5, and if there is bias, you can see that the value close to 0 and 1 increases.
This bias can be seen by looking at the graph up to 3D, but in the case of high dimensions, vector quantization label classification seems to be good.
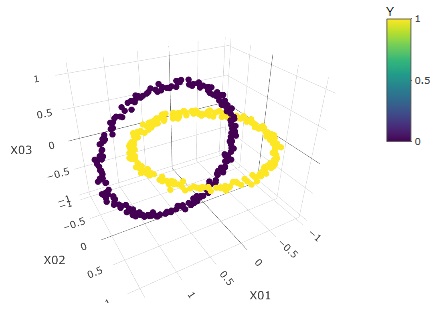
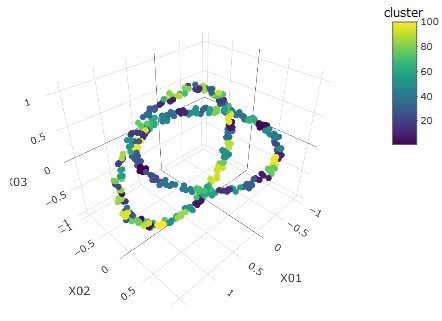
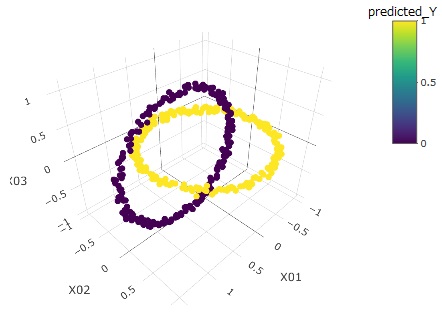
The graphs below, from left to right, are the source data, clusters, and predicted values.
I make 100 clusters.
Even with such a complex distribution, vector quantization label classification can be seen to be perfectly predictable.
An example of R can be found on the Vector quantization label classification by R page.
NEXT  Outlier Detection
